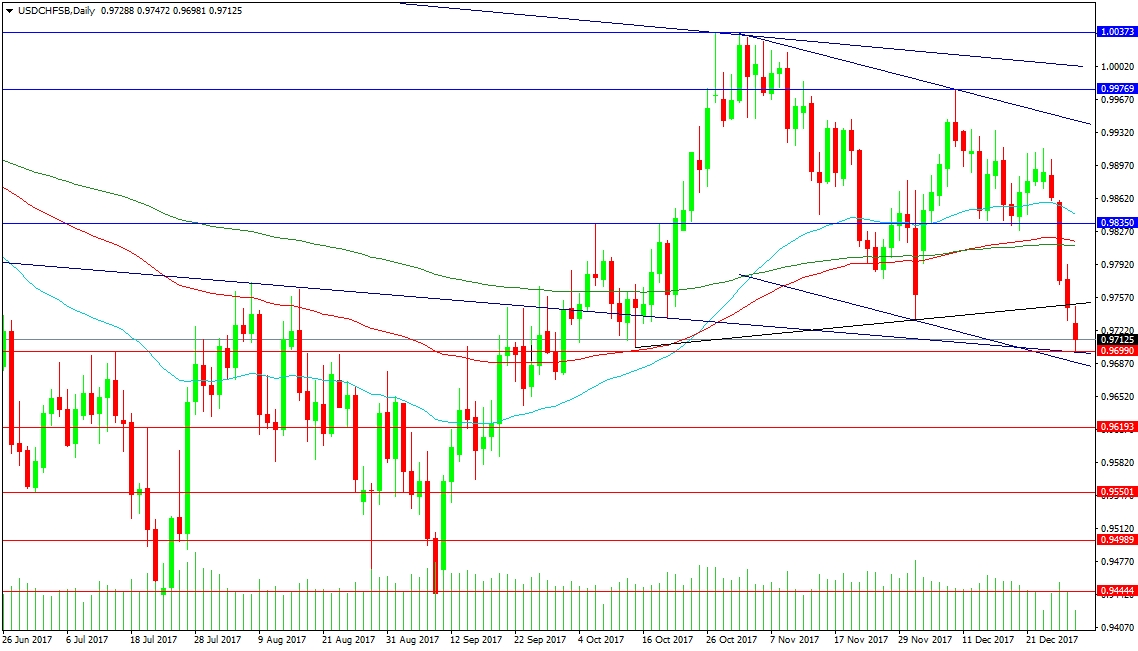
The USD has been under pressure recently, with the Swiss Franc one of the currencies seeing the price action trend lower. Since early November, the pair has dropped from the 1.00365 level. Today it stands at 0.97000. The price has come lower in a channel and at the current price is close to the bottom trend line at 0.96872. Should a test on this area firm up as support and turn higher, traders will look to the 0.97500 level to provide resistance. Based on this move, the next stage should become apparent.
If 0.97500 is broken, the next resistance is 0.98110 and the 100 and 200-period moving averages (100 DMA) on the daily chart. Above this is 0.98350 and the 50 DMA. The next resistance is then the top of the channel at 0.99425. A break above here, followed by a close on the Daily chart above parity (1.00000), would confirm a Bull flag breakout targeting 1.050000.
To the downside, a break below the channel targets the first support at 0.96193, followed by 0.95501. This would shake out long positions from the September rally and could reach 0.94444 if selling pressure gains momentum.
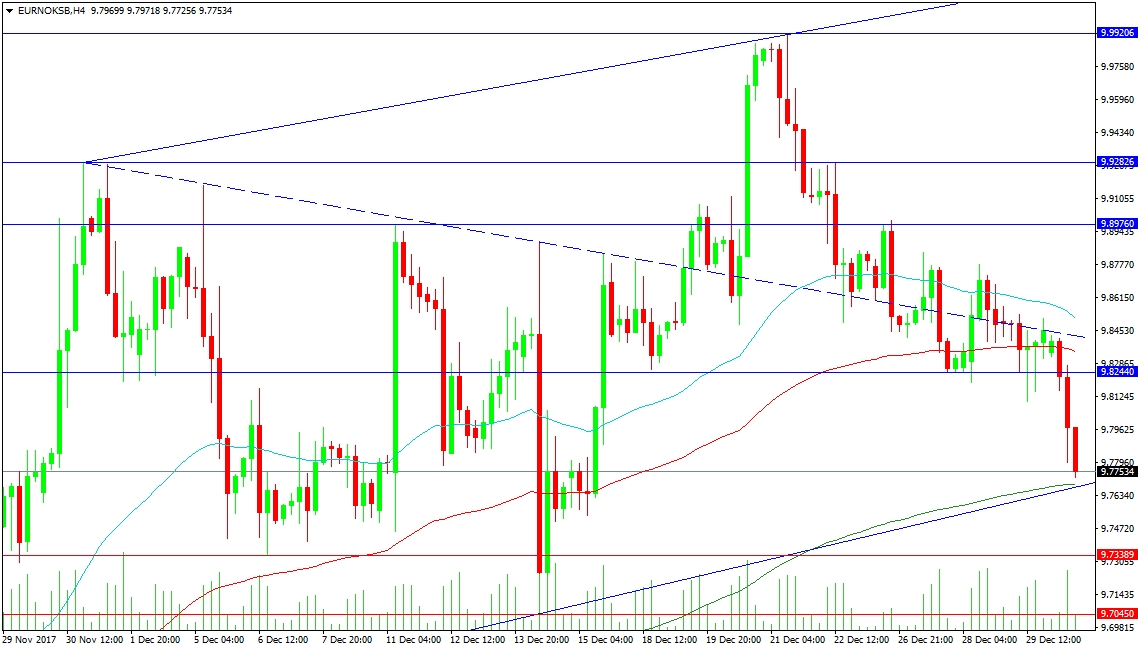
EUR/NOK is moving lower to test its 200-period moving average in a 4 Hour timeframe. This corresponds with a rising trend line at 9.76714. Further support can be found at 9.73389 and 9.70450. After the break out of the dashed trend line, a high was made at 9.99206 but the retest of the trend line broke down and resulted in the current lows.
Should the pair bounce from the 200 MA, the dashed trend line represents a zone of resistance with the 50 and 100 MAs. A break above here can see a test of resistance at 9.89760 and 9.92826. Overcoming these levels points the way to the high at 9.99206.


