Key Points:
- Price action collapses below bullish trend line
- RSI Oscillator strongly oversold
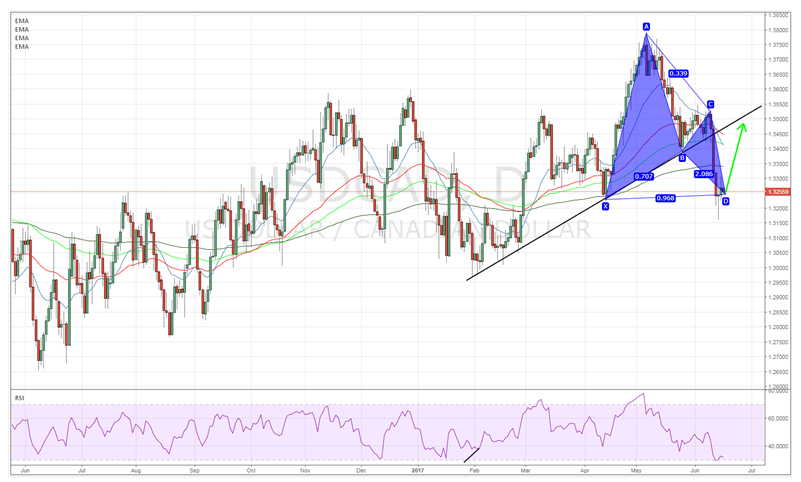
- ABCD pattern completes and retest of the trend line is likely in the coming session
The USD/CAD has benefitted from a strong trend line that has been supporting price action since early January, 2017. Subsequently, the trend line has proved fairly reliable in trading long reversals but price action has proved elusive in the past week and dropped sharply through the trend line. However, the move was primarily fundamental in nature and some interesting technical factors might be just about to signal a retest.
In fact, the primary reason for the recent decline was a fundamental response to a shock announcement from the Bank of Canada that they intend to review their current level of stimulus with a desire to taper. Although this provides some useful forward guidance for the market, it fails to provide either a timeline or the extent to which the central bank intends to taper their QE. Subsequently, the initial sharp decline is likely to be short term and reactionary rather than a medium term change to the equilibrium between the two currencies. In comparison, the U.S. Federal Reserve has largely communicated a timeline of rate hikes and their desire to taper which is likely to only see upward momentum for the pair.

A quick technical analysis of the loonie largely demonstrates the above factors with price action's collapse below the medium term bullish trend line. However, it’s clear that the RSI Oscillator is currently strongly within oversold territory which suggests that, at the least, a mean reversion is likely to occur. Additionally, an ABCD pattern appears to have just completed which should see price action rising back towards the trend line, around the 1.3500 handle, over the next few sessions.
Ultimately, the stage is now set for a textbook rally and retest of the trend line, especially given the completion of the ABCD pattern. Subsequently, the scenario which I strongly favour, both fundamentally and technically, is a short period of sideways moderation before an upside break towards the trend line at 1.3500. At that point, it’s likely that price action will run into some resistance around the 1.3535 mark and a momentum stall could occur. However, given the technical and rising gap between the U.S. and Canadian economies (Canada faces a potential property crash and falling oil prices) this level of depressed valuation is only going to last for a short period of time.
