The US Dollar to Canadian Dollar (USD/CAD) exchange rate is a forex major pair and one of the world’s most traded currency pairings.
The charts used are from TradingView and the prices are from FXCM.
USD/CAD Forecast
In the daily chart we see USD/CAD Forex pair trading in an established downtrend. Last candelsticks challenging 1.2470 levels.
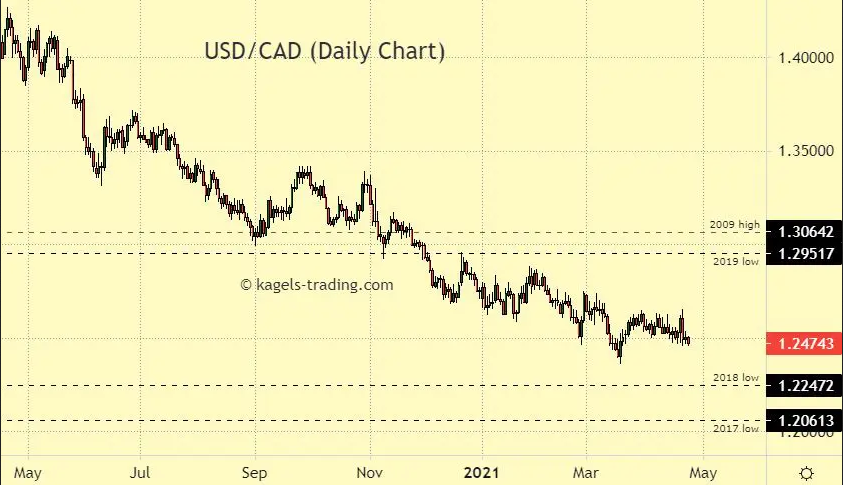
Resistance: 1.2951 | 1.3064
Support: 1.2247 | 1.2061
USD/CAD Forecast
The daily chart of USD/CAD looks negative. We expect a continuation of the established downtrend. Only a price advance above key resistance zone around 1.3000 could turn the chart picture to positive. The previous low is located at 1.2365.
USD/CAD price prediction
USD/CAD on the weekly chart is moving in an established downtrend and trading below 2019 low.
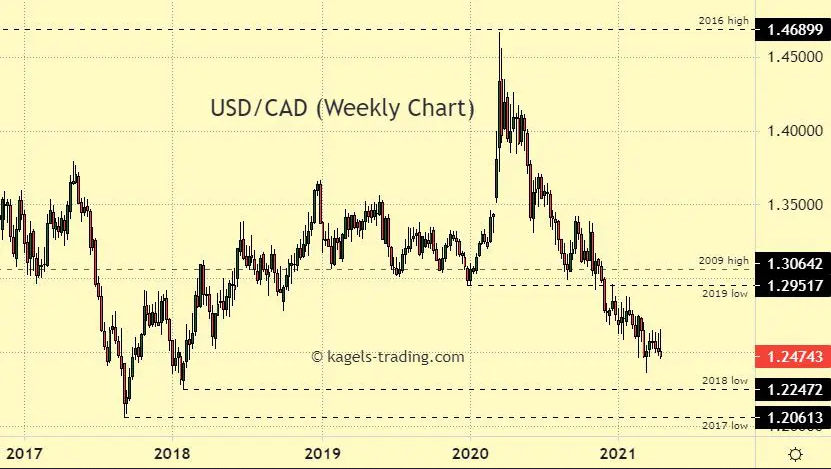
Resistance: 1.2951 | 1.3064
Support: 1.2247 | 1.2061
USD/CAD prediction
The weekly chart of USD/CAD looks negative. We expect a continuation of the established downtrend. Only a price advance above key resistance around 1.3064 could turn the chart picture to positive.
USD/CAD price prediction
USD/CAD on the monthly chart is trading between the 2019 and 2018 lows. We see a downward move from 2016 high level since March 2020.
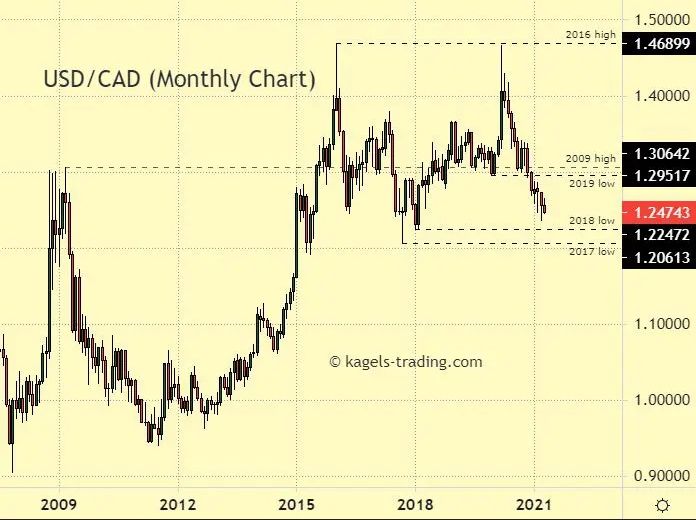
Resistance: 1.2951 | 1.3064
Support: 1.2247 | 1.2061
USD/CAD prediction
The monthly chart of USD/CAD looks slightly negative. Next price target could be 2018 low at 1.2247. Only a price advance above key resistance around 1.3064 could turn the chart picture to positive.
USD/CAD Forecast
On the quarterly chart of USD/CAD we can see a big trading range for the last six years. The major forex pair is moving sideways between 1.2000 and 1.4700 and currently trading between the 2019 and 2018 lows.
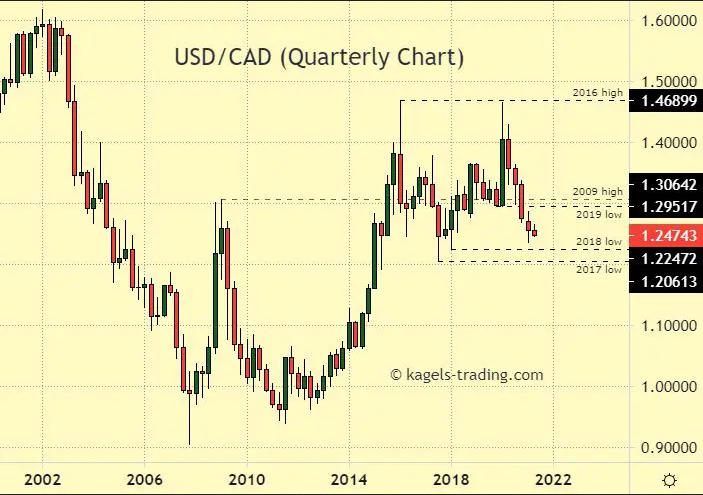
Resistance: 1.2951 | 1.3064
Support: 1.2247 | 1.2061
USD/CAD forecast
The quarterly chart of USD/CAD looks neutral to slightly negative. We expect a continuation of the big trading range. Only a price advance above key resistance around 1.3064 could turn the chart picture to positive.
USD/CAD Outlook
On the yearly chart of USD/CAD we can see a big trading range for the last six years. The major forex pair is moving sideways between 1.2000 and 1.4700.
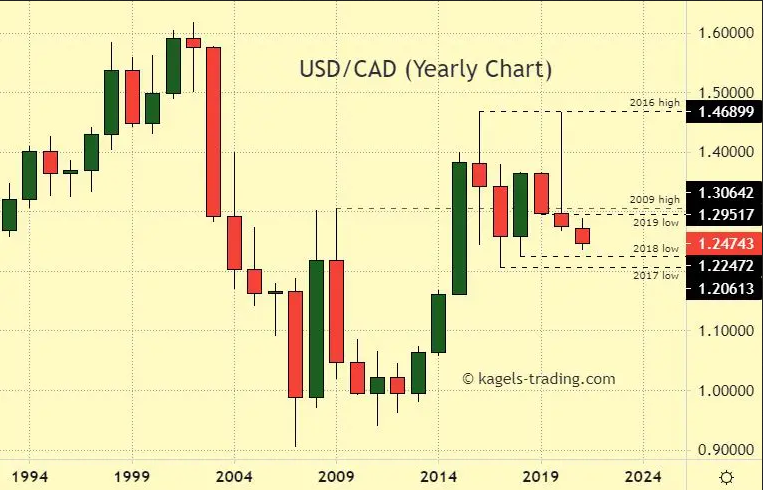
Resistance: 1.2951 | 1.3064
Support: 1.2247 | 1.2061
USD/CAD Forecast
The yearly chart of USD/CAD looks neutral to slightly negative. We expect a continuation of the big trading range.
About USD/CAD
The Currency Pair USD/CAD is the shortened term for the US-Dollar against Canadian Dollar, or cross for the currencies of the United States (USD) and Canada (CAD). For example, if the pair is trading at 1.3300, it means it takes 1.3300 Canadian Dollar to buy 1 US-Dollar.
*This price prediction is based on the data collected from various sources. This should not be considered as an investing parameter and user should do their own research before investing.
