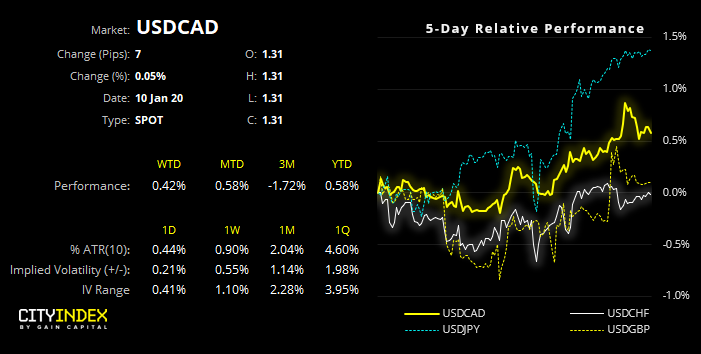
With both the U.S. and Canada set to release employment figures at 13:30 GMT, USD/CAD warrants a look.
Data has generally undershot expectation for Canada since the end of November. Given BOC have a base rate of 1.75%, it appears to be only a matter of time before they’re forced to lower rates. Yet Poloz seems to think otherwise.
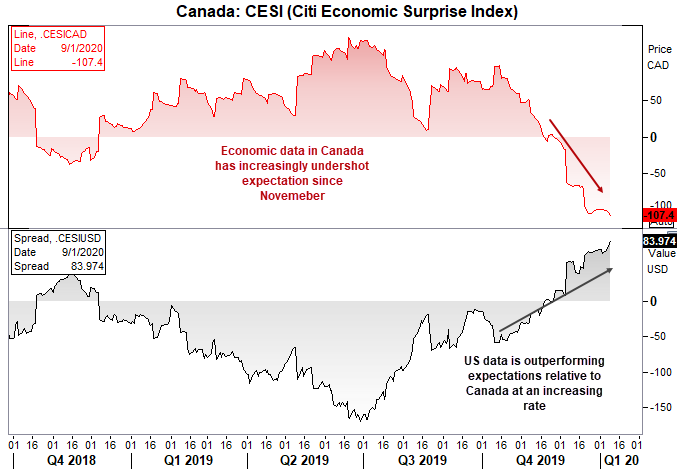
Despite dovish remarks from Assistant Governor Wilkinson in November, Governor Poloz refused to play along and has retained his neutral stance in the face of weak data, even as recently as yesterday’s ‘fireside’ talk.
Citing ‘bad weather and strikes’ as a source for weak Q4 data, Poloz also thinks that business investment may be much stronger than originally anticipated. If so, then we’ll have to revise our expectations for BOC to cut, but it doesn’t change the fact that the U.S. data is outperforming expectations relative to Canada. And this could place upside pressure on USD/CAD if this trend persists.
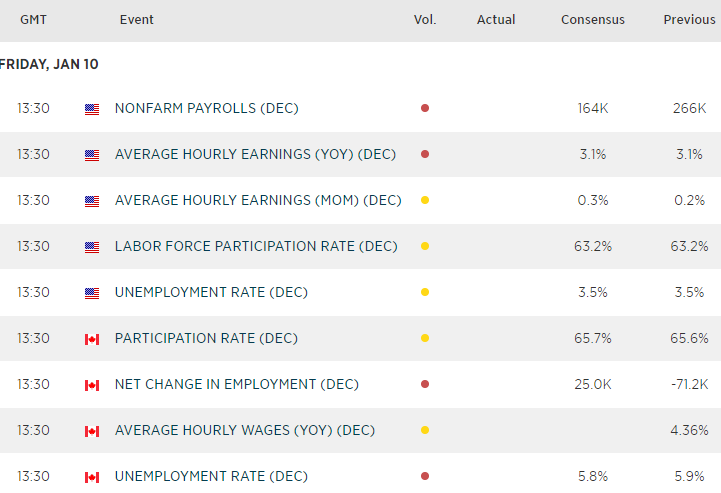
In last month’s employment report, Canadian unemployment rose to 5.9% (5.8% prior, 16-month high) and 71.2k lost making it the largest monthly drop since 2009. So for CAD’s perspective, this is what to watch out for:
USD/CAD Bullish: If unemployment remains at or above 5.9% and we see another large decline in jobs, it suggests that November’s data was not an outlier and there could be worse to come. If this is coupled with an okay (or better) employment set from the U.S., we’d expect USD/CAD to break above 1.3103 with relative ease
USD/CAD bearish: However, expectations are for unemployment to revert to 5.8% and see +25k jobs added. We shouldn’t even need to see data exceeded expectations for this to be CAD positive (USD/CAD negative) as it suggests that November’s report was an outlier and that Poloz may be right to keep his neutral stance. Obviously, if this is coupled with stronger than expected data from Canada and weaker from the US, it only adds to the bearish case for USD/CAD.
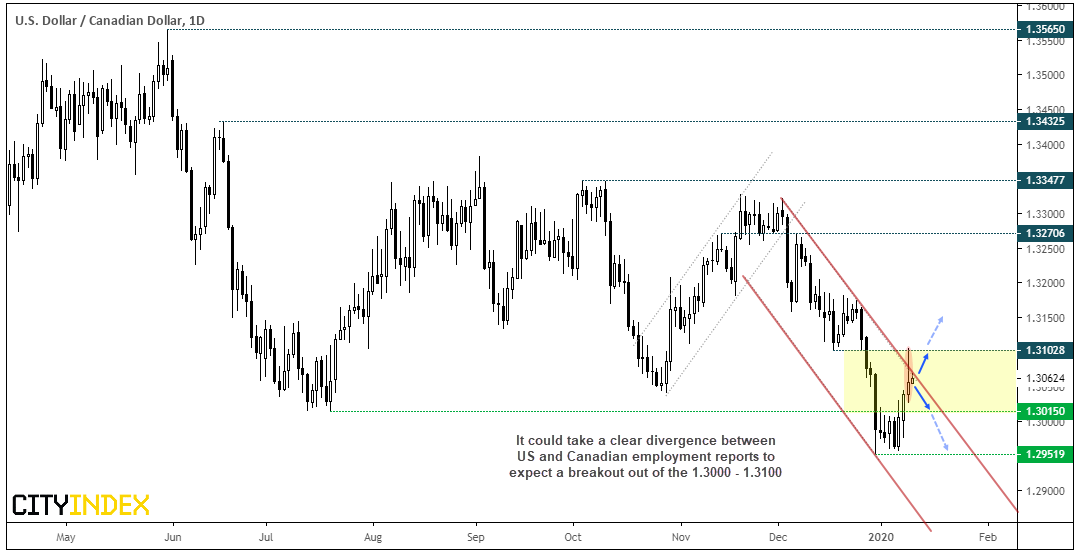
USD/CAD Daily: Wednesday’s close above the 2019 low showed that mean reversion was underway, with yesterday’s high breaching the December trendline and testing 1.3103 resistance. However, the bearish hammer closed beneath the trendline and shows a hesitancy to move higher ahead of today’s employment line-up. Trading around mid-way between 1.3000 – 1.3100, we could find prices remains between this zone if reports from US and Canada are mixed. It will therefore likely take a clear divergence between the US and Canadian employment reports to see the 1.3015 – 1.3100 range be broken today.
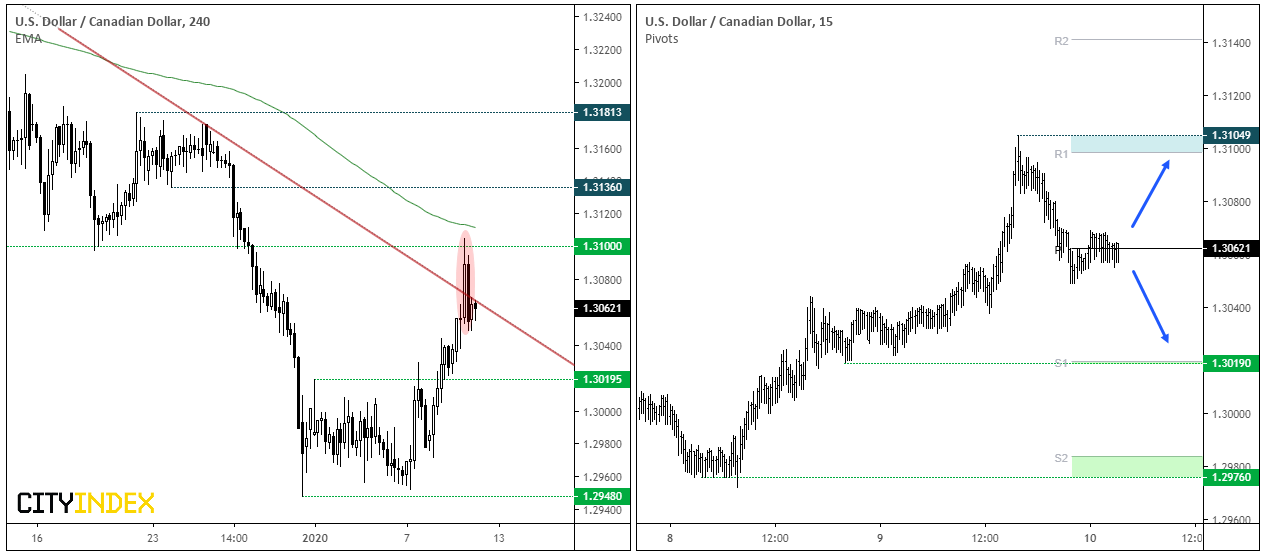
USD/CAD Intraday: A bearish engulfing candle / 2-bar reversal has formed on the 4-hour chart. The 1.3100 handle held and there’s also the 200-period eMA just above, so it could take a strong US beat and CA miss for these levels to break with conviction.
Switching to the 15-minute chart, it’s worth noting that prices remain anchored to the pivot point S1 and R1 sit on structural levels. This provides a clear range for intraday traders to consider trading within, with a relatively unobscured view.
