Key Points:
- RSI Oscillator trending higher despite price falling.
- ABCD pattern completes near key support zone.
- Upside move likely in the coming days.
The loonie has been under pressure the past few weeks as the pair has reacted to slumping sentiment for the greenback, as well as rising crude oil prices which have buoyed the CAD. Subsequently, price action has continued to creep lower over the ensuing period bringing it to a relatively critical juncture. However, there are some encouraging signs appearing amongst the technical indicators that could just be predisposing the pair to a rally in the near term.
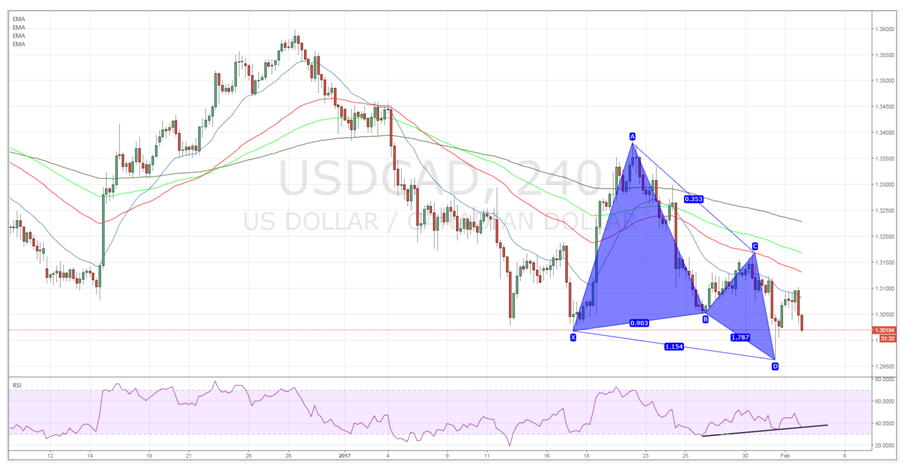
In particular, a quick technical analysis for the pair has proved relatively illuminating as the 4-hour timeframe currently highlights the current inflexion point. Price action is currently sitting right on some strong support at 1.3020 which, if broken, could take the pair sharply lower. However, an ABCD pattern has just completed which suggests that a retracement is the likely move ahead.
In addition, the past week has started to show some interesting pressure building within the RSI Oscillator. After having reached oversold territory, in the latter part of January, the oscillator is now trending steadily higher in contrast to price actions current direction. Subsequently, there is divergence evident within the indicator which is likely to predispose the pair to a retracement in the coming days.

Fundamentally, much of the Canadian dollar’s strength against the greenback has come from the rising crude oil prices that have been seen throughout most of 2017. This was largely due to an OPEC agreement on production which seemingly cut some excess supply. However, the evidence to date is starting to suggest that Iran, Iraq, and Nigeria are likely to undermine the agreement and that we might have seen the last of the oil price rises for the quarter. Subsequently, this adds some weight to the view that the CAD might now start to retreat against the US dollar.
Ultimately, the USD/CAD is unlikely to fall much further given the depth of support around the 1.30 handle. This is especially the case given the completed ABCD pattern and the current RSI Oscillator divergence. Subsequently, watch for an upward move over the next few sessions back towards the initial take profit point around the 1.31 handle.
