Key Points:
- Reversal likely at the strong zone of resistance around the 1.3129 level.
- Triangle or Rising Wedge pattern could cap upside potential going forward.
- May low could be challenged again in the event of a breakout.
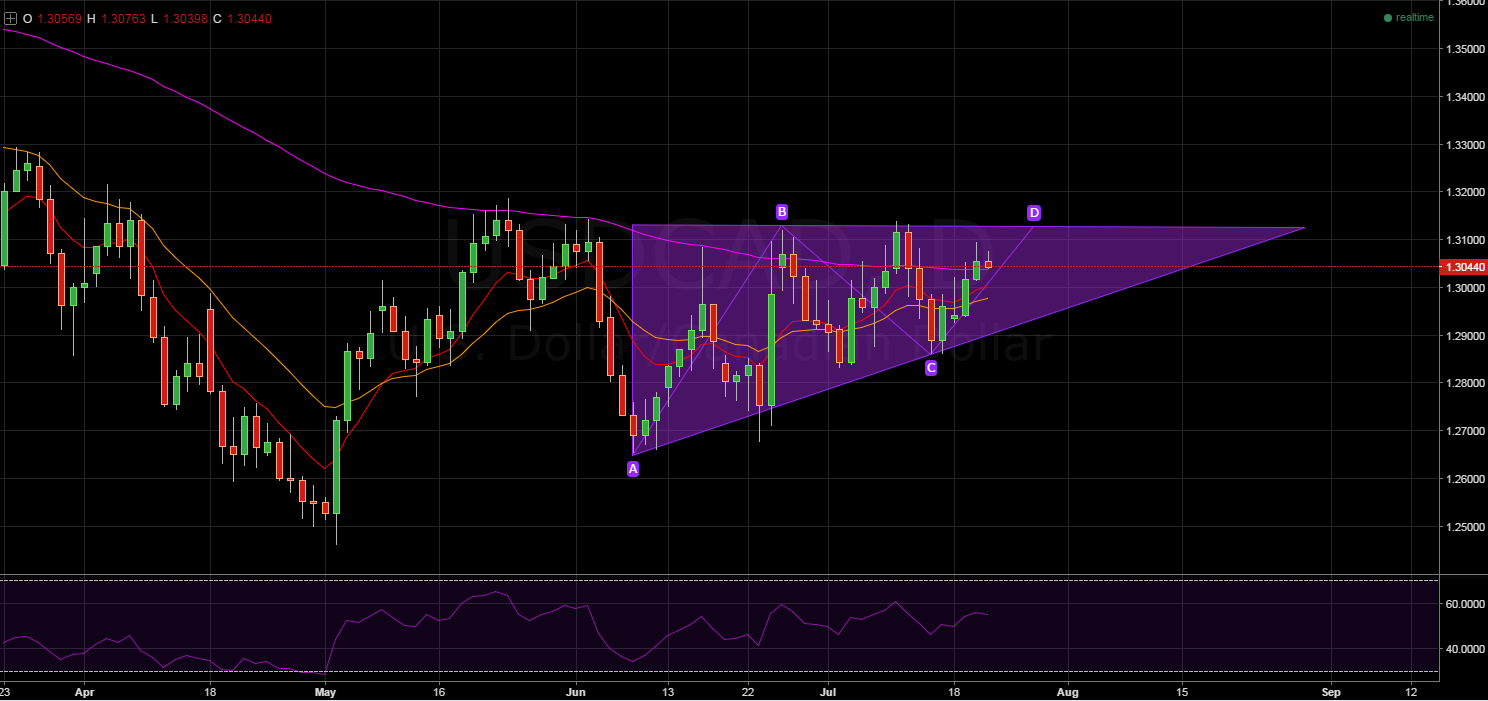
The Loonie has been consolidating in a fairly predictable manner over the past number of weeks, even with the upset caused by the UK referendum. Resistance around the 1.3129 mark has proven to be a fairly immovable obstacle and, likewise, the downside constraint of the consolidation pattern has remained unbroken. As a result, another reversal can be expected in the coming sessions and a technical breakout is not likely to occur until mid-August.
Whilst earlier forecasts signalled that the pair could be consolidating in a pennant configuration, recent price action now indicates that the Loonie could be forming an ascending triangle or rising wedge pattern. Consequently, the USD/CAD is now expected to test resistance at the 1.3129 level or the 1.32 handle. If the former holds firm, this will confirm the presence of the ascending triangle pattern. However, if the latter proves to be the point of inflection, then a rising wedge formation is more likely to eventuate.

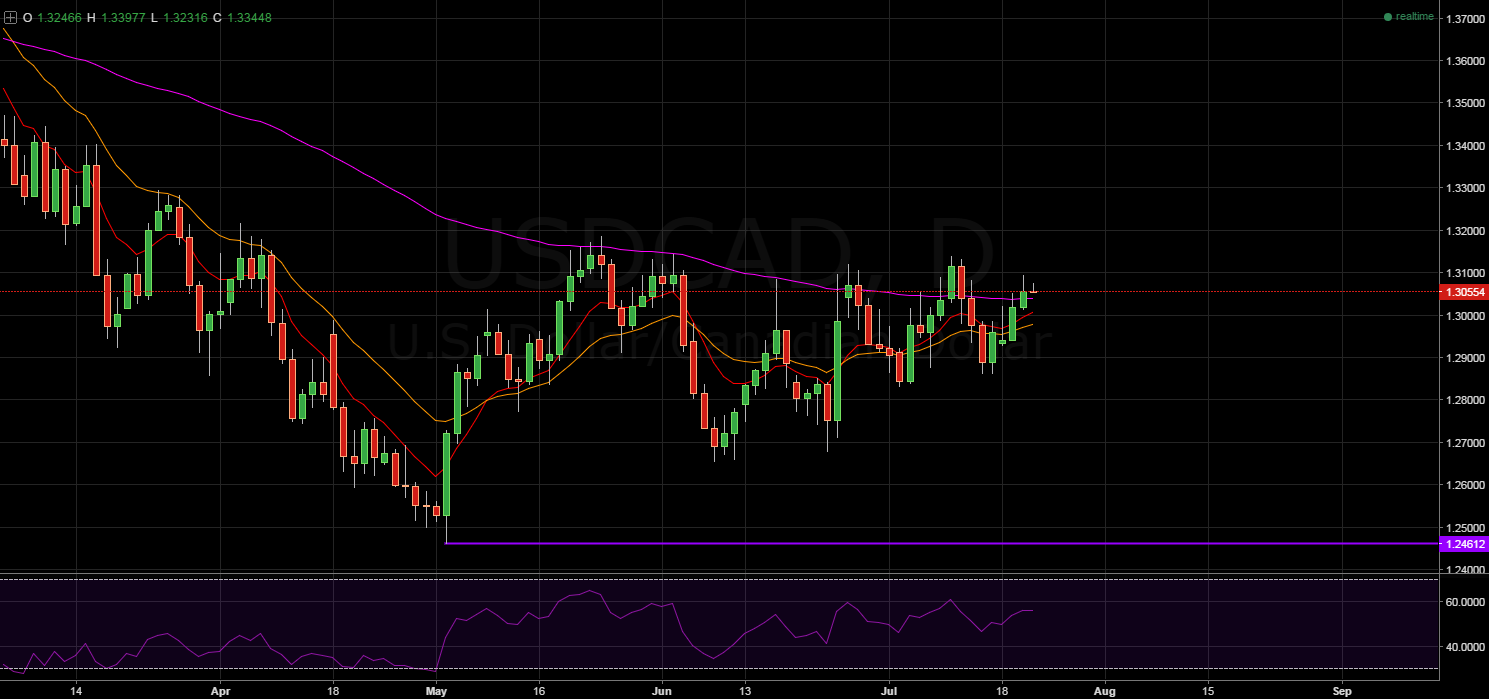
In either scenario, the upside potential for this pair is somewhat limited relative to the possible magnitude of the downside breakout which could occur upon the completion of the consolidation phase. Whilst the outcome of a triangle pattern is somewhat ambiguous, a rising wedge typically precedes the resumption of a downtrend. As a result, the recent price movements could be hinting that the Loonie is set to tumble back to the May low of 1.2461.

Supporting the case for a reversal and subsequent bearish breakout is not only theEMA activity, but the Parabolic SAR readings as well. As shown on the above chart, the 100 day EMA remains stubbornly bearish. Although it is flattening out to a degree, in the absence of a crossover with the 12 and 20 day EMA’s, a strong rally is unlikely to occur. In addition to this, the daily Parabolic SAR reading also remains bearish and this could limit the pair’s ability to break through resistance.
Ultimately, the Loonie is highly likely to reverse as the week comes to a close, especially given the proven strength of the 1.3129 zone of resistance. As a result, in the short-term, we can expect the pair to consolidate in one of the two aforementioned patterns around the 1.2951 price level. Coincidentally, this will likely be the price at which the next support is found if the recent trend of higher lows is continued. Additionally, in the medium-term, a breakout to the downside is presently forecasted for August and it could take the pair back to its May low. However, as always, keep a close watch on both the US and Canadian fundamental results as the Loonie reaches resistance because they could see the consolidation phase ended prematurely.
