As my colleague Fawad Razaqzada noted earlier today, the big market theme at the start of this week is persistent weakness in oil prices. Both the WTI and Brent contracts are at new multi-month lows this morning and are within sight of the multi-year lows set earlier in 2015 after record high oil output from OPEC.
Beyond the oil market itself, this move is also having a spillover effect on other major markets as well. Predictably, US-traded energy stocks (ARCA:XLE) are trading down 0.5% in premarket trade, but the moves in the forex market are arguably more interesting. The oil-linked currencies of Russia and Norway are both on the back foot, with USD/NOK probing its 4-month high around 8.25 and USD/RUB at a 5-month high of 62.50.
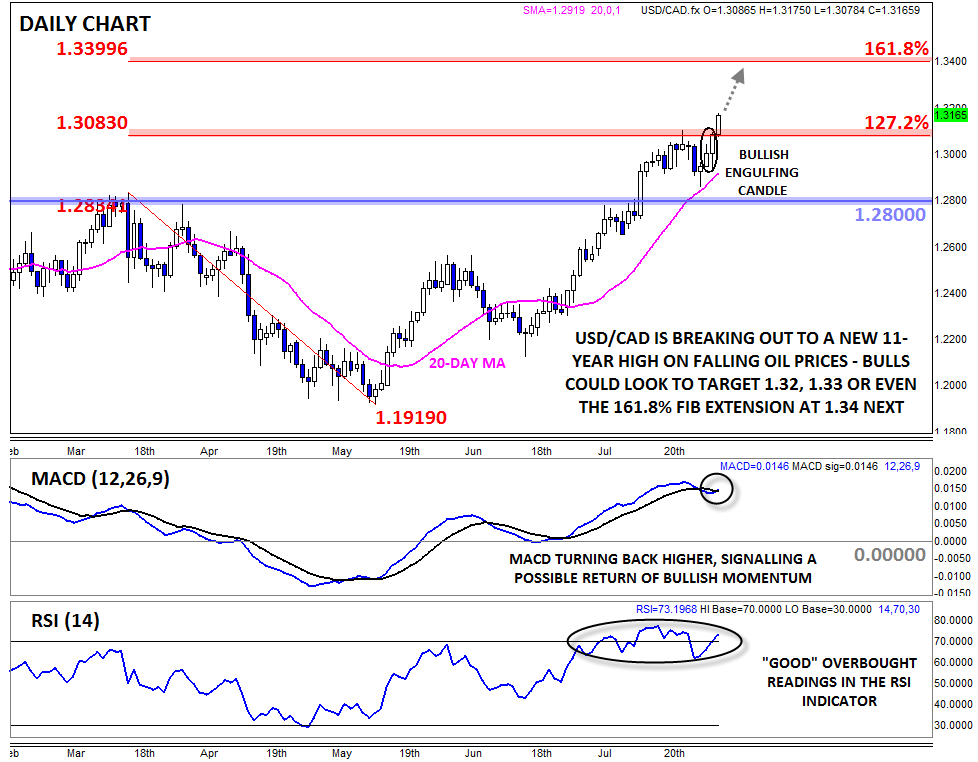
The most widely-followed oil-linked currency is the Canadian dollar, and as we anticipated last week, USD/CAD has now broken out to a new 11-year high above 1.3100 so far today. While today’s drop in oil prices served as the fundamental catalyst, the technical picture for USD/CAD has been pointing higher for the last several weeks. After breaking out above previous resistance at 1.2800, the pair rallied all the way to its 11-year high in the 1.3060-1.3100 zone before pulling back modestly to support at its 20-day MA, alleviating the overbought condition in the RSI indicator in the process. Friday’s clear Bullish Engulfing Candle* hinted that the buyers were regaining the upper hand and foreshadowed today’s big breakout.
Looking ahead, the pair’s bias will remain to the topside as long as we hold above previous-resistance-turned-support in the 1.3060-1.3100 zone. The MACD has seemingly turned higher once again, heralding the return of bullish momentum, and the RSI continues to show “good” overbought readings, with the indicator oscillating around the 70 level and no major pullbacks in USD/CAD itself. From here, there’s hardly any technical resistance standing in the way of the bullish stampede. Buyers may want to focus on the round 100-pip handles at 1.3200 and 1.3300 as possible resistance, and above those levels sits the 161.8% Fibonacci extension of this year’s dip at 1.3400. Meanwhile, the bullish trend will remain healthy as long as the 20-day MA serves as near-term support.
Key Economic Data / News that Could Impact USD/CAD This Week (all times GMT):
- Today: US ISM Manufacturing PMI (14:00)
- Tuesday: US Factory Orders (14:00)
- Wednesday: US ADP Non-Farm Employment Report (12:15), US and Canadian Trade Balance data (12:30), US ISM Non-Manufacturing PMI (14:00), Crude Oil Inventory Data (14:30)
- Thursday: US Initial Unemployment Claims (12:30)
- Friday: Canadian Building Permits, Canadian Employment Report, US Non-Farm Payrolls report (12:30), Canadian Ivey PMI (14:00)
*A Bullish Engulfing candle is formed when the candle breaks below the low of the previous time period before buyers step in and push rates up to close above the high of the previous time period. It indicates that the buyers have wrested control of the market from the sellers.

