Monday’s session was very good for the sellers. Although their opponents took USD/CAD higher, the previously-broken support/resistance line stopped them, triggering a sharp pullback and making currency bears more profitable. Is the worst already behind currency bulls?
Focus On USD Index

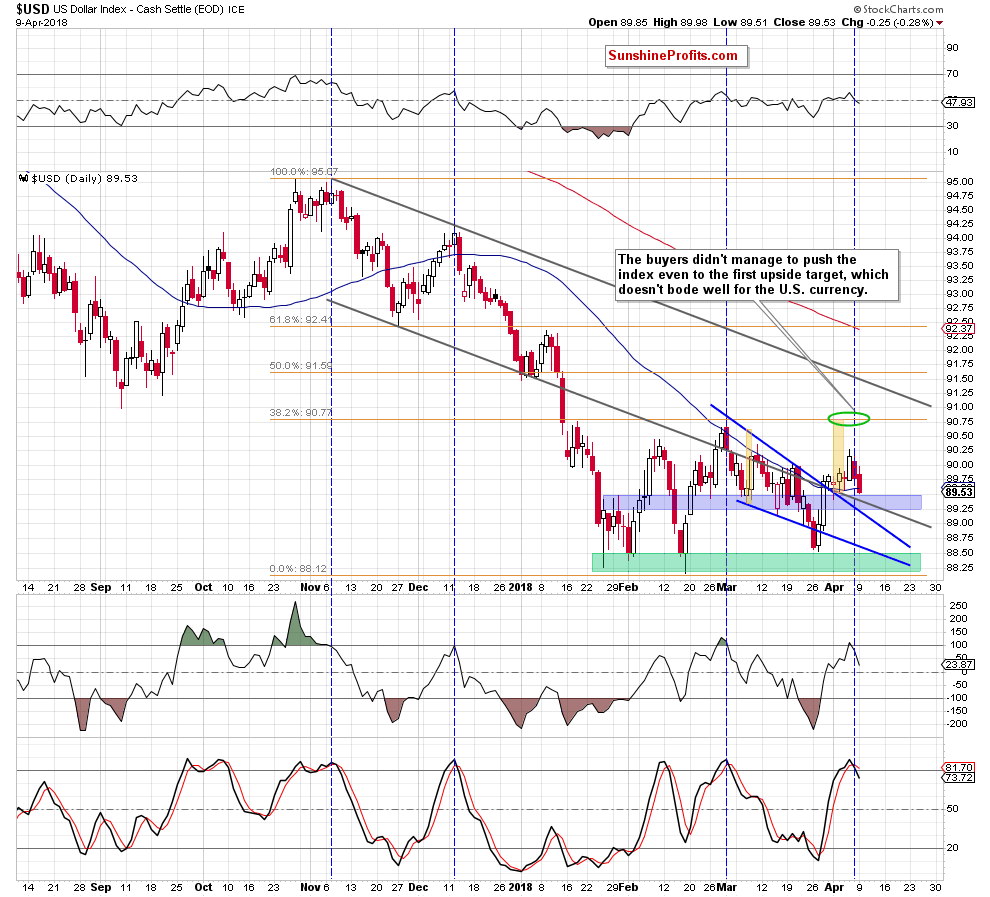
From today’s point of view, we see that although the USD Index invalidated the earlier breakdown under the lower border of the grey declining trend channel and broke above the upper line of the blue declining wedge (and then verified this breakout), we didn’t notice an increase even to the first upside target marked on the daily chart.
Instead, the index slipped to the previously-broken blue zone and dropped under the 50-day moving average, closing yesterday’s session under this support. Additionally, the CCI and the Stochastic Oscillator generated the sell signals, suggesting further deterioration in the coming days.
Can we trust them? Looking at the chart above, we see that in all previous cases, similar situations (we marked them with the blue vertical dashed lines) preceded bigger moves to the downside, which increases the probability that the history will repeat itself once again in the very near future.
Thanks to the recent drops of the U.S. dollar, one of the currency pairs extended losses significantly, making currency bears’ (and ours) short positions even more profitable. Which of them do we mean? Let’s take a look at the chart below.
USD/CAD Rewards Patience

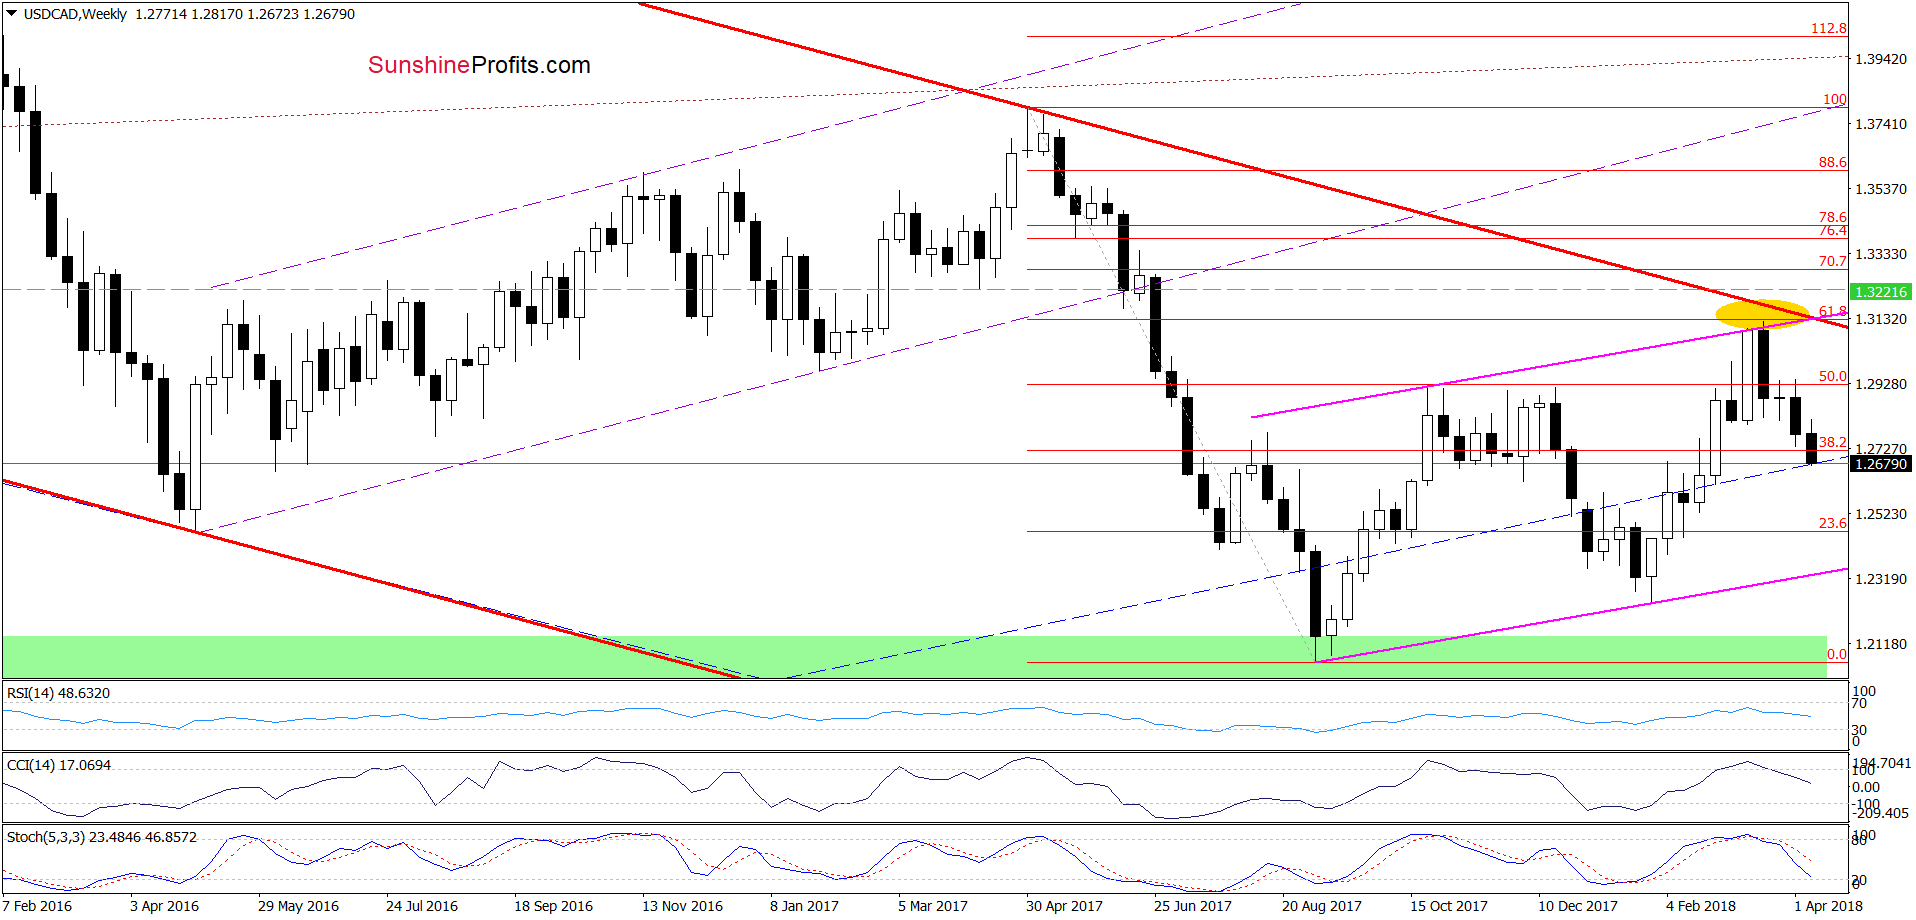
From the medium-term perspective, we see that USD/CAD extended losses earlier this week, which together with the sell signals generated by the weekly indicators supports currency bears and lower values of the exchange rate.
How low could USD/CAD go in the coming week?

Before we answer to this question, let’s recall the quote from our Forex Trading Alert posted on April 4, 2018:
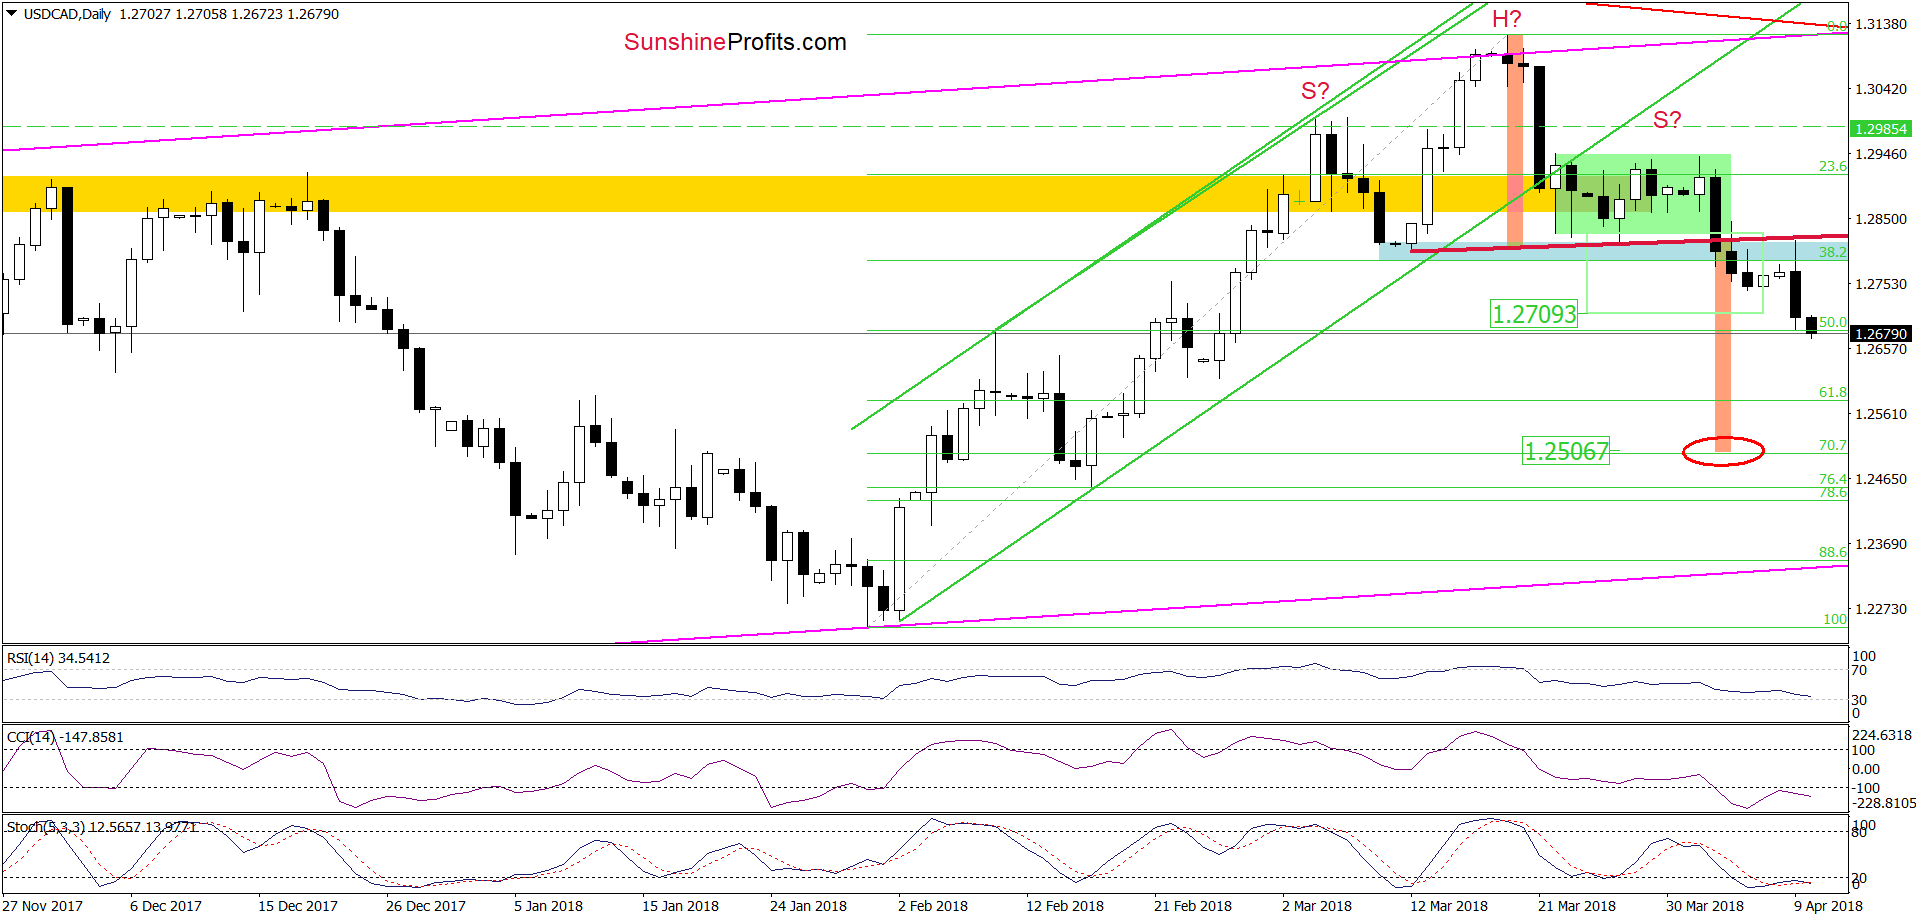
(…) USD/CAD declined sharply (...) and reached our next downside target - the blue support zone and the 38.2% Fibonacci retracement.
Although this support area could trigger a rebound, the sell signals generated by the indicators remain in the cards, which together with yesterday’s breakdown suggest further deterioration and a drop to around 1.2709, where the size of the move will correspond to the height of the green consolidation.
Taking all the above into account, we decided to lower the stop loss order (…) to protect some of our earlier profits and (…) we move our downside target lower once again (…)
Looking at the daily chart, we see that currency bears pushed USD/CAD lower as we had expected. Yesterday, the exchange rate moved higher, but currency bulls didn’t manage to break above the neck line of the head-and-shoulders formation. As a result, the exchange rate reversed and declined sharply, reaching our next downside target and making the short positions even more profitable.
Although the CCI and the Stochastic Oscillator dropped to their oversold areas, the medium-term picture in combination with today’s drop below the 50% Fibonacci retracement suggests that there is still space for declines.
Where will USD/CAD head next?
In our opinion, the next downside target will be around 1.2580, where the 61.8% Fibonacci retracement is. Taking this fact into account, we decided to lower the stop loss order once again to protect more of our earlier profits and at the same time, we moved our downside target lower once again to let our profits grow.
Nevertheless, we will continue to monitor the market and keep our subscribers informed should we see a confirmation/invalidation of the above.
Thank you.
