Let’s look at the U.S. Dollar over the last 3.5 years.
Stiff Resistance
With the exception of June 2010 -- when the dollar traded as high as 88.80 -- the 84/84.50 level has served as stiff resistance. It appears a triple-top pattern is being established on the weekly chart over the last three weeks. The horizontal red line shows the dollar’s three failed attempts -- Aug. 2010, July 2012 and May 2013 (it seems, so far). Stochastics are starting to roll over and I’m anticipating a 50% Fibonacci retracement to unfold, which would drag prices under 81, where the greenback traded in early 2013. Such retracement would put futures under their 20-day and 50-day MAs on the weekly chart… which are kind of a big deal. As of this post, on the daily chart, June futures are under their 20-day MA for the first time since May 9 and on the precipice of breaking below the 50-day MA, now just 15 ticks away from current trade.
So, why is the U.S. dollar’s action so closely monitored?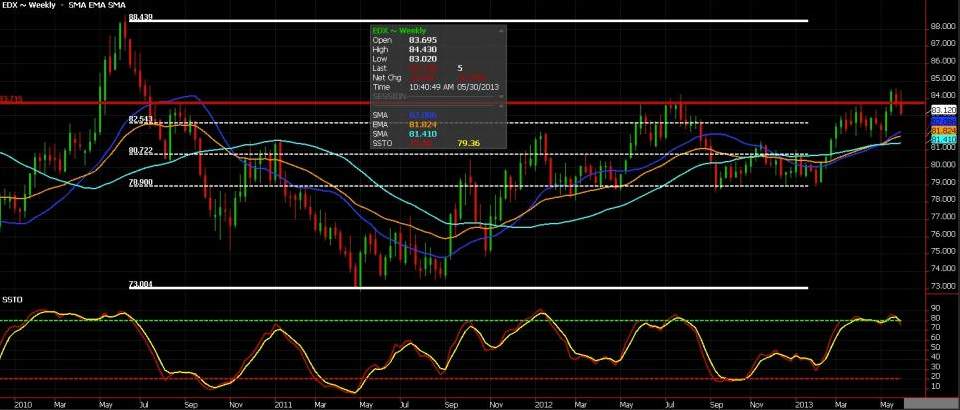
It's War
Because we’re in the middle of a currency war! Nations around the globe are in a race to weaken their currencies. So far, the Japanese are in the lead, but quick on their tail are a number of European nations. The greenback’s near 7% gain since February 1 only confirms what I’ve said before -- the dollar is just the best house in the worst neighborhood.
Lots To Watch
With market participants eyeing the possibility of QE3 tapering off, central bank meetings, GDP figures, payroll data, unemployment figures and perceived inflation levels will be in the limelight in the coming weeks.
As for trade ideas, if you’re not willing to be short the dollar… let’s look to buy commodities and non-U.S. dollar currencies…instruments that typically exhibit an inverse relationship with the greenback. In my opinion, we could see short-term appreciation in energies, metals, cocoa, all European FX crosses (Euro, Swiss and Cable) and commodity currencies (Loonie, Aussie and Kiwi).
- English (UK)
- English (India)
- English (Canada)
- English (Australia)
- English (South Africa)
- English (Philippines)
- English (Nigeria)
- Deutsch
- Español (España)
- Español (México)
- Français
- Italiano
- Nederlands
- Português (Portugal)
- Polski
- Português (Brasil)
- Русский
- Türkçe
- العربية
- Ελληνικά
- Svenska
- Suomi
- עברית
- 日本語
- 한국어
- 简体中文
- 繁體中文
- Bahasa Indonesia
- Bahasa Melayu
- ไทย
- Tiếng Việt
- हिंदी
USD: Is Its Number Up?
Published 05/30/2013, 01:20 PM
Updated 07/09/2023, 06:31 AM
USD: Is Its Number Up?
Latest comments
Loading next article…
Install Our App
Risk Disclosure: Trading in financial instruments and/or cryptocurrencies involves high risks including the risk of losing some, or all, of your investment amount, and may not be suitable for all investors. Prices of cryptocurrencies are extremely volatile and may be affected by external factors such as financial, regulatory or political events. Trading on margin increases the financial risks.
Before deciding to trade in financial instrument or cryptocurrencies you should be fully informed of the risks and costs associated with trading the financial markets, carefully consider your investment objectives, level of experience, and risk appetite, and seek professional advice where needed.
Fusion Media would like to remind you that the data contained in this website is not necessarily real-time nor accurate. The data and prices on the website are not necessarily provided by any market or exchange, but may be provided by market makers, and so prices may not be accurate and may differ from the actual price at any given market, meaning prices are indicative and not appropriate for trading purposes. Fusion Media and any provider of the data contained in this website will not accept liability for any loss or damage as a result of your trading, or your reliance on the information contained within this website.
It is prohibited to use, store, reproduce, display, modify, transmit or distribute the data contained in this website without the explicit prior written permission of Fusion Media and/or the data provider. All intellectual property rights are reserved by the providers and/or the exchange providing the data contained in this website.
Fusion Media may be compensated by the advertisers that appear on the website, based on your interaction with the advertisements or advertisers.
© 2007-2024 - Fusion Media Limited. All Rights Reserved.