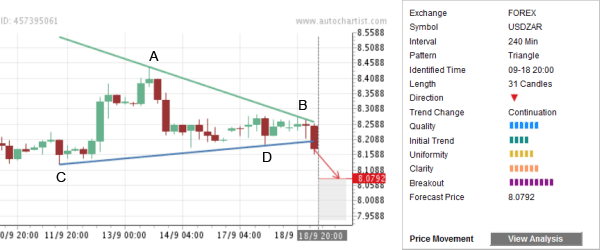
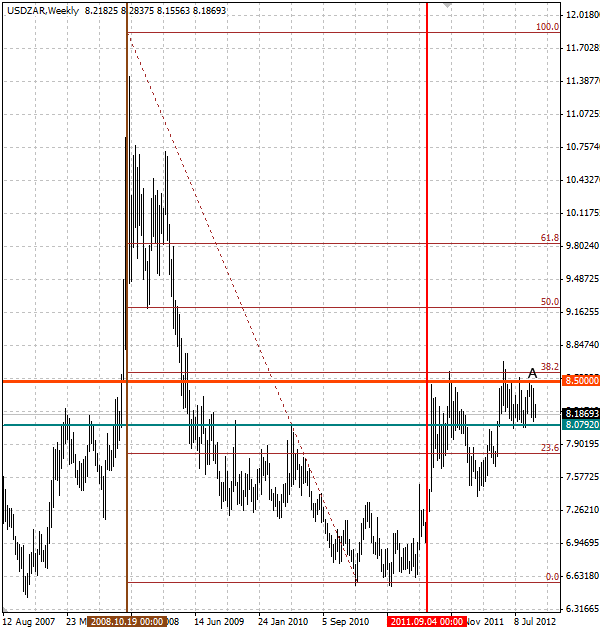
USD/ZAR today completed the Triangle chart pattern identified by Autochartist on the 4-hour charts. The overall Quality of this chart pattern is rated at the 6 bar level as a result of the below-average Initial Trend (4 bars), higher Uniformity (5 bars) and above-average Clarity (6 bars). The top of this Triangle (point A on the chart below) formed when the pair reversed down form the strong resistance area lying between the round price level 8.5000 and the 38,2% Fibonacci Retracement of the previous sharp weekly downward price impulse from the October of 2008 (as is shown on the second chart below). The pair has made numerous attempts to break up above this resistance area from the end of last year. USD/ZAR is expected to fall further toward the Forecast Price 8.0892.

The weekly USD/ZAR chart below shows the technical price levels mentioned above:


The weekly USD/ZAR chart below shows the technical price levels mentioned above:

