Nearer term $/zar outlook :
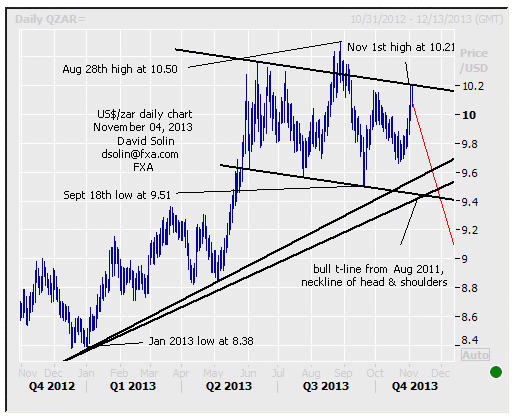
The market is consolidating from the Aug 28th high at 10.50 (test of long term, 12 year bearish trendline, see longer term below), and is seen in process of a topping for at least a few months (potentially much more). Appear to be forming a head and shoulders since June, generally viewed as a reversal/bearish pattern, and suggests declines to the neckline (currently at 9.40/45, also the bullish trendline from Aug 2011) and eventually below (see in red on daily chart below). Currently, the market is testing key resistance at the ceiling of the bear channel from June (currently at 10.21), an "ideal" area to form the right shoulder, and suggests that such a downside resolution may be nearing. Further resistance above there is seen at 10.36/39 (left shoulder) and the Aug high at 10.50, support before the neckline is seen at 9.66/69 and the bullish trendline from Jan (currently at 9.54/57).
Strategy/position:
With a top for at least a few months seen forming, want to be short and would sell here (currently at 10.08). Initially use a wide stop on a close above that 12 year bearish trendline, as there is some risk for another week or 2 of a broader topping ahead.
Long term outlook:
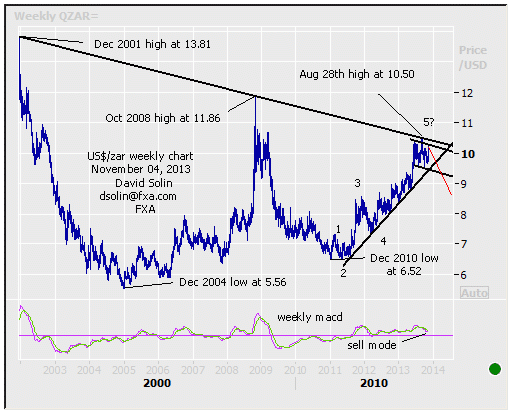
As discussed above, the market is consolidating from the Aug 28th high at 10.50 and test of the long term, bearish trendline from Dec 2001. Note too that there are number of other, longer term negative signs and suggests that an even more substantial top (for 9-12 months or more) may be forming. These negatives include an overbought market after the surge from the Dec 2010 low at 6.52, potential completion of the 5 wave upmove from that low (see numbering on weekly chart/2nd chart below), and bearish long term technicals (see sell mode on the weekly macd). Also don't forget that more substantial reversals generally begin with smaller ones....
Strategy/position:
With a top for at least a few months (and potentially much more) seen in process of forming, would also switch the longer term bias to the bearish side here (currently at 10.08).
Current:
Near term : short Nov 4th at 10.08, topping for at least a few months.
Longer term : bearish Nov 4th at 10.08, potentially more major top also in place.  USD/ZAR" title="Daily USD/ZAR" height="416" width="515" />
 USD/ZAR" title="Weekly USD/ZAR" height="416" width="515" />
- English (UK)
- English (India)
- English (Canada)
- English (Australia)
- English (South Africa)
- English (Philippines)
- English (Nigeria)
- Deutsch
- Español (España)
- Español (México)
- Français
- Italiano
- Nederlands
- Português (Portugal)
- Polski
- Português (Brasil)
- Русский
- Türkçe
- العربية
- Ελληνικά
- Svenska
- Suomi
- עברית
- 日本語
- 한국어
- 简体中文
- 繁體中文
- Bahasa Indonesia
- Bahasa Melayu
- ไทย
- Tiếng Việt
- हिंदी
USD/ZAR: A Major Topping
Latest comments
Loading next article…
Install Our App
Risk Disclosure: Trading in financial instruments and/or cryptocurrencies involves high risks including the risk of losing some, or all, of your investment amount, and may not be suitable for all investors. Prices of cryptocurrencies are extremely volatile and may be affected by external factors such as financial, regulatory or political events. Trading on margin increases the financial risks.
Before deciding to trade in financial instrument or cryptocurrencies you should be fully informed of the risks and costs associated with trading the financial markets, carefully consider your investment objectives, level of experience, and risk appetite, and seek professional advice where needed.
Fusion Media would like to remind you that the data contained in this website is not necessarily real-time nor accurate. The data and prices on the website are not necessarily provided by any market or exchange, but may be provided by market makers, and so prices may not be accurate and may differ from the actual price at any given market, meaning prices are indicative and not appropriate for trading purposes. Fusion Media and any provider of the data contained in this website will not accept liability for any loss or damage as a result of your trading, or your reliance on the information contained within this website.
It is prohibited to use, store, reproduce, display, modify, transmit or distribute the data contained in this website without the explicit prior written permission of Fusion Media and/or the data provider. All intellectual property rights are reserved by the providers and/or the exchange providing the data contained in this website.
Fusion Media may be compensated by the advertisers that appear on the website, based on your interaction with the advertisements or advertisers.
© 2007-2025 - Fusion Media Limited. All Rights Reserved.
