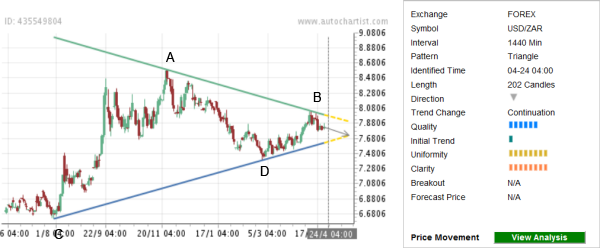
We have recently identified the extended Triangle chart pattern on the daily USD/ZAR charts. The length of this Triangle is equal to 202 candles. We rate the overall Quality of this chart pattern at the 6 bar level as a consequence of the low Initial Trend (measured at the one bar level) and substantial Uniformity and Clarity (both rated at the 8 bar level).
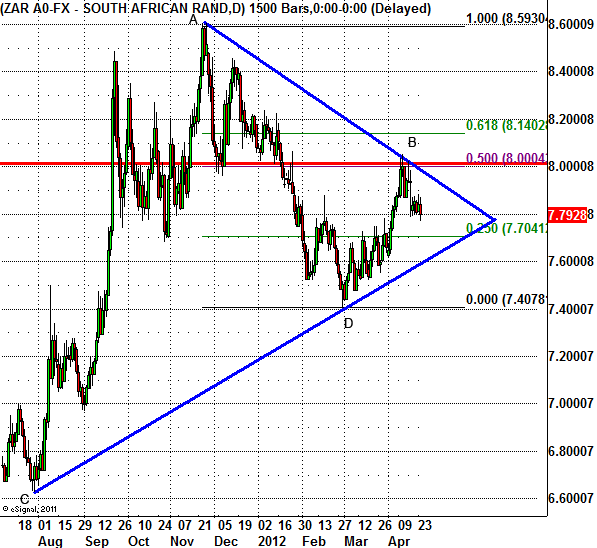
This chart pattern develops in line with the long-term downtrend visible on the weekly USD/ZAR charts. The latest downward reversal at point B occurred when pair failed to break up above the strong resistance area lying at the intersection of the round price level 8.0000 and the 50% Fibonacci Retracement of the preceding downward price impulse from A to D, as is shown on the second chart below. The pair is expected to fall further in the coming sessions.

The following daily USD/ZAR chart highlights the technical price levels mentioned above:

This chart pattern develops in line with the long-term downtrend visible on the weekly USD/ZAR charts. The latest downward reversal at point B occurred when pair failed to break up above the strong resistance area lying at the intersection of the round price level 8.0000 and the 50% Fibonacci Retracement of the preceding downward price impulse from A to D, as is shown on the second chart below. The pair is expected to fall further in the coming sessions.

The following daily USD/ZAR chart highlights the technical price levels mentioned above:

