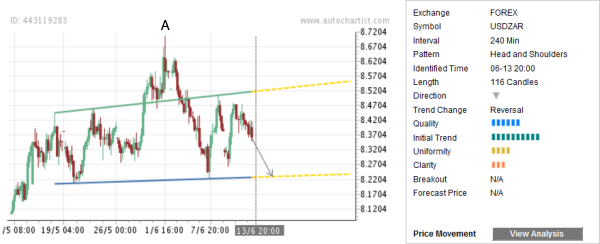
USD/ZAR continues to fall inside the Head and Shoulders chart pattern identified on the 4-hour charts. We rate the overall Quality of this chart pattern at the 6 bar level as a result of the maximum Initial Trend (measured at the 10 bar level), and lower Uniformity and Clarity (rated at the 4 and 3 bar levels respectively). This chart pattern reverses the preceding sharp upward correction (whose strength is reflected by the maximum Initial Trend value) to the predominant downtrend visible on the weekly USD/ZAR charts.
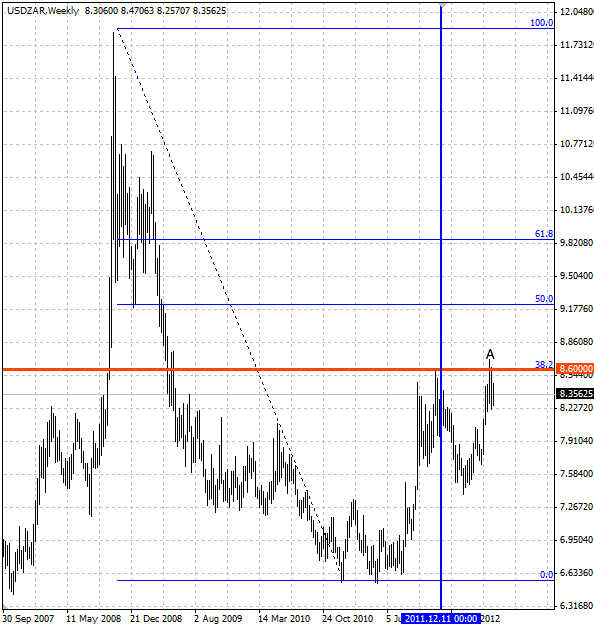
The top, or the “head” of this chart pattern (point A) formed when the pair reversed down from the strong combined resistance lying at the intersection of the long-term resistance level 8.6000 (which reversed the pair down in the end of 2011) and the 38,2% Fibonacci Retracement of the preceding sharp weekly downward price impulse from the October of 2008 (as is shown on the second chart below). The pair is expected to fall further in the nearest time.

The following weekly USD/ZAR chart shows the technical price levels mentioned above:
 USD/ZAR" title="USD/ZAR" width="594" height="627" />
The top, or the “head” of this chart pattern (point A) formed when the pair reversed down from the strong combined resistance lying at the intersection of the long-term resistance level 8.6000 (which reversed the pair down in the end of 2011) and the 38,2% Fibonacci Retracement of the preceding sharp weekly downward price impulse from the October of 2008 (as is shown on the second chart below). The pair is expected to fall further in the nearest time.

The following weekly USD/ZAR chart shows the technical price levels mentioned above:
 USD/ZAR" title="USD/ZAR" width="594" height="627" />