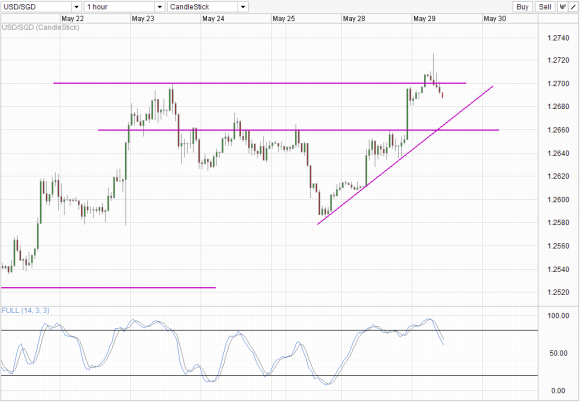
we discussed whether the recent bullish breakout of 1.26 was still in play, and concluded that the answer is yes. Price eventually did retest 1.27 once again and even tagged above 1.272 in the process, in line with the assertion of current bullish breakout. However, the overall cautions that were expressed yesterday remains as well, with prices trading back below 1.27 once again during early Asian trade.
Hourly Chart USD/SGD_1" title="USD/SGD_1" width="580" height="402">
From a technical perspective, it seem that 1.27 is a strong resistance to behold in the short-term. With the failure to hold above 1.27, the 1.266 and the rising trendline opens up as potential bearish target. There is still the possibility of 1.268 acting as interim support, and should the level hold, it will not be surprising to see bulls being able to retest 1.27 and potentially higher once again. Stochastic indicator suggest that a bear cycle is underway, which enforces the idea of 1.27 as a strong resistance.
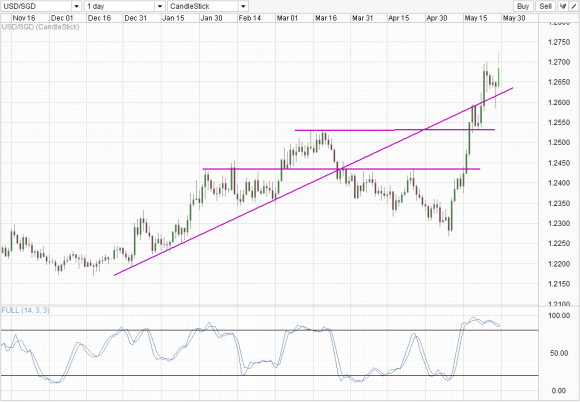
Daily Chart USD/SGD_2" title="USD/SGD_2" width="580" height="402">
Nothing has changed much from the Daily Chart, with current breakout still in play yet there is no evidence that price is undergoing a bullish extension from here. Today’s candle is looking likely to close below the previous swing high back on 23rd May, and points to further consolidation around 1.265. The dangers of price holding current levels until the rising trendline takes over remains, and that could usher in a new bearish retracement towards 1.255. Stochastic readings are unclear currently – though readings were heading lower and hints of a bear cycle looks possible, the Stoch line has since flattened just above 80.0 and is looking likely to cross the Signal line to form an interim trough within the Overbought region. Also, the recent Stoch peaks since May 15th has been trending lower, while price peaks have headed higher, which suggest that bearish signals from Stoch should be filtered out. Nonetheless, if the bear cycle does take flight, it would be highly complementary to the break of the rising trendline and affirms a potential strong retracement.
Fundamentals remain the same and nothing much has change since yesterday. However it is worth noting that yesterday’s better than expected US Consumer Sentiment data drove USD stronger and thus USD/SGD higher. With Preliminary US GDP data coming up on Thursday 8.30am EDT, it is likely that this news may help us determine short-term direction between bulls and bears especially if price remain consolidating around 1.265. Long term implications remains upbeat in favor of USD due to the strength of US Stocks that is driving USD higher. Hence a weak US GDP figure may not be strong enough to steer current Stock trends but only result in a shorter-mid term pullback.
- English (UK)
- English (India)
- English (Canada)
- English (Australia)
- English (South Africa)
- English (Philippines)
- English (Nigeria)
- Deutsch
- Español (España)
- Español (México)
- Français
- Italiano
- Nederlands
- Português (Portugal)
- Polski
- Português (Brasil)
- Русский
- Türkçe
- العربية
- Ελληνικά
- Svenska
- Suomi
- עברית
- 日本語
- 한국어
- 简体中文
- 繁體中文
- Bahasa Indonesia
- Bahasa Melayu
- ไทย
- Tiếng Việt
- हिंदी
USD/SGD: Short-Term Double Top Or Temporary Pullback?
Published 05/29/2013, 02:43 AM
Updated 07/09/2023, 06:31 AM
USD/SGD: Short-Term Double Top Or Temporary Pullback?
Yesterday
Latest comments
Loading next article…
Install Our App
Risk Disclosure: Trading in financial instruments and/or cryptocurrencies involves high risks including the risk of losing some, or all, of your investment amount, and may not be suitable for all investors. Prices of cryptocurrencies are extremely volatile and may be affected by external factors such as financial, regulatory or political events. Trading on margin increases the financial risks.
Before deciding to trade in financial instrument or cryptocurrencies you should be fully informed of the risks and costs associated with trading the financial markets, carefully consider your investment objectives, level of experience, and risk appetite, and seek professional advice where needed.
Fusion Media would like to remind you that the data contained in this website is not necessarily real-time nor accurate. The data and prices on the website are not necessarily provided by any market or exchange, but may be provided by market makers, and so prices may not be accurate and may differ from the actual price at any given market, meaning prices are indicative and not appropriate for trading purposes. Fusion Media and any provider of the data contained in this website will not accept liability for any loss or damage as a result of your trading, or your reliance on the information contained within this website.
It is prohibited to use, store, reproduce, display, modify, transmit or distribute the data contained in this website without the explicit prior written permission of Fusion Media and/or the data provider. All intellectual property rights are reserved by the providers and/or the exchange providing the data contained in this website.
Fusion Media may be compensated by the advertisers that appear on the website, based on your interaction with the advertisements or advertisers.
© 2007-2025 - Fusion Media Limited. All Rights Reserved.