After reaching 1.27 last week, price has been firmly trading below the level, pushing as low as 1.257 at one point. However price still managed to rally higher, breaking above the rising trendline, but that proved to be a false dawn with price quickly trading back below the rising trendline again, breaking 1.2625 interim support in the meantime.
Daily Chart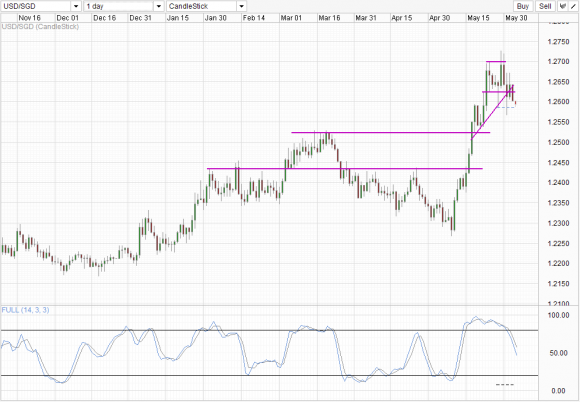 USD/SGD_1" title="USD/SGD_1" width="580" height="402">
A large part of the recovery “false dawn” is due to USD gathering strength last Friday. This is strange considering that US stocks actually traded lower, which should translate into a weaker USD based on recent correlation. But it doesn’t matter anyway, as SGD strengthened significantly during today’s trading session, pulling USD/SGD sharply lower. This move seems to be more SGD related with USD being mostly flat against most other majors. There doesn’t seem to be any strong Singapore related news that could have catalyzed this sell-off. However, from a technical perspective, it is not hard to understand when prices are continuing to head lower – Stochastic readings pointing down after clearing the 80.0 level, suggesting that a bear cycle is underway, in line with what the break of 1.2625 and ascending trendline suggest. Furthermore it is worth noting that price was already on its way for a bearish break and it was only “saved” by the breakdown of correlation between USD and US stocks, which is in no way changing the original bearish sentiment that has been in play since 29th May.
Hourly Chart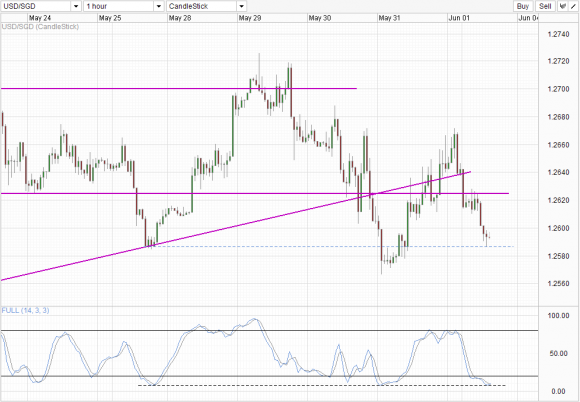 USD/SGD_2" title="USD/SGD_2" width="580" height="402">
Short-term chart shows an interim support just under 1.259. It is interesting that price and stoch levels both met around here previously on 25th May, almost exactly 1 week ago. If past patterns repeat, then this would be the best setup for bulls to retry 1.27 again. If this level fails, then it is likely that price will be able to test the previous swing low of 31st May, and potentially beyond, despite Stoch readings being deeply oversold.
From a Fundamental perspective, there are good reasons for USD/SGD to head lower, if USD revert back to the positive correlation relationship with US stock once again. S&P500 and DJI are showing signs of topping, and may start to unravel themselves, which could push USD weaker and USD/SGD lower. However if his morning’s price action is of any indication, we could see USD/SGD moving on by it self based on technical sentiment and ignoring broad USD trends. There is some possible explanation as well – as commercial entities were spotted selling USD/SGD above 1.25 to hedge back in March, it is likely that they may wish to do so once again if they believe the longer-trend for USD/SGD is lower. This self-fulfilling prophecy may indeed cause USD/SGD to sink especially since liquidity tends to be thin. Coupled with MAS (Singapore Central Bank) reluctance to weaken the currency, there will not be strong fundamental opposition against a stronger SGD, giving bears of USD/SGD free reign below.
- English (UK)
- English (India)
- English (Canada)
- English (Australia)
- English (South Africa)
- English (Philippines)
- English (Nigeria)
- Deutsch
- Español (España)
- Español (México)
- Français
- Italiano
- Nederlands
- Português (Portugal)
- Polski
- Português (Brasil)
- Русский
- Türkçe
- العربية
- Ελληνικά
- Svenska
- Suomi
- עברית
- 日本語
- 한국어
- 简体中文
- 繁體中文
- Bahasa Indonesia
- Bahasa Melayu
- ไทย
- Tiếng Việt
- हिंदी
USD/SGD: Bullish Breakout Invalidated
Published 06/03/2013, 07:00 AM
Updated 07/09/2023, 06:31 AM
USD/SGD: Bullish Breakout Invalidated
Latest comments
Loading next article…
Install Our App
Risk Disclosure: Trading in financial instruments and/or cryptocurrencies involves high risks including the risk of losing some, or all, of your investment amount, and may not be suitable for all investors. Prices of cryptocurrencies are extremely volatile and may be affected by external factors such as financial, regulatory or political events. Trading on margin increases the financial risks.
Before deciding to trade in financial instrument or cryptocurrencies you should be fully informed of the risks and costs associated with trading the financial markets, carefully consider your investment objectives, level of experience, and risk appetite, and seek professional advice where needed.
Fusion Media would like to remind you that the data contained in this website is not necessarily real-time nor accurate. The data and prices on the website are not necessarily provided by any market or exchange, but may be provided by market makers, and so prices may not be accurate and may differ from the actual price at any given market, meaning prices are indicative and not appropriate for trading purposes. Fusion Media and any provider of the data contained in this website will not accept liability for any loss or damage as a result of your trading, or your reliance on the information contained within this website.
It is prohibited to use, store, reproduce, display, modify, transmit or distribute the data contained in this website without the explicit prior written permission of Fusion Media and/or the data provider. All intellectual property rights are reserved by the providers and/or the exchange providing the data contained in this website.
Fusion Media may be compensated by the advertisers that appear on the website, based on your interaction with the advertisements or advertisers.
© 2007-2025 - Fusion Media Limited. All Rights Reserved.