 USD/SGD-1" title="USD/SGD-1" width="580" height="394">
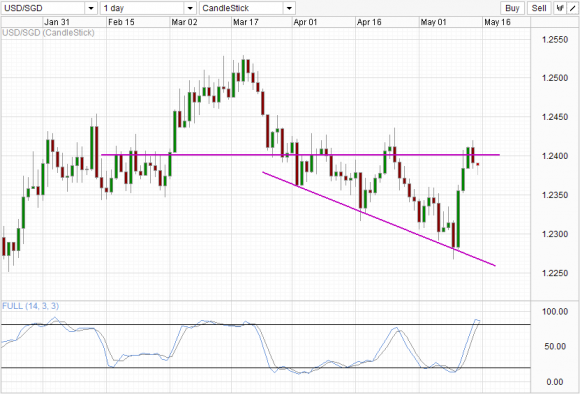
USD/SGD is once again in familiar territory, with price forming tops around 1.24 back on 8th and 24th April. Before April, we have 1st, 12th and 24th Feb where price move above 1.24 only to see strong reversal the next day. Stochastic readings are also pointing lower, looking likely to peak which is in line with expectations of a 1.24 top. However, before we assume that price is indeed topping here, it is important to note that current price levels are still higher than yesterday’s low. Furthermore, today’s low is above the top of consolidation zone found between April 11 – 16. This is an indication that there are still bulls lurking around, and given the strong manner which price rebounded from sub 1.23 to above 1.24, traders may want to seek further bearish confirmation before calling it a top.
Hourly Chart USD/SGD - 2" title="USD/SGD - 2" width="580" height="392">
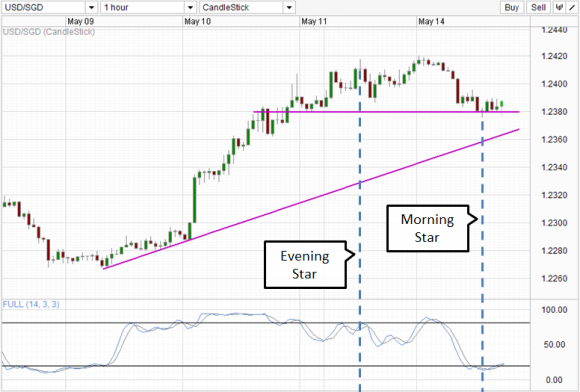
The strength of bulls is even more pronounced via the Hourly Chart. Stochastic readings are looking at the initial stages of a bull cycle, while price itself is potentially showing a Bullish Reversal Morning Star pattern just above 1.238. If the previous evening star was of any reference, price could still push towards 1.24 especially if 1.239 interim resistance is broken. A break below 1.238 will open up rising trendline for some support, and a break below support will help to accelerate price towards 1.23 and below. On the bullish front, price will preferably need to push above 1.242 in order for us to see a complete negation of topping scenario to one of a bullish continuation towards 1.25.