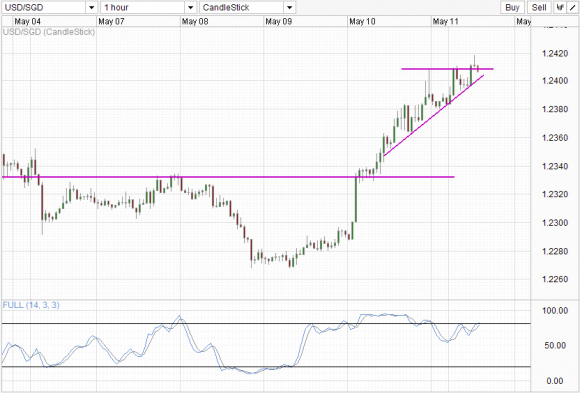
USD/SGD has been climbing steadily since the breakout of 1.233 on Friday, represented by the rising trendline. Price rallied stronger on Monday open due to USD/JPY jumping higher following the non-sanction by G7 during their recent London meeting. The strengthening of USD was also spotted from risk currencies such as AUD/USD and EUR/USD, with the USD strength pushing USD/SGD higher.
Hourly Chart USD/SGD" title="USD/SGD" width="580" height="393">
Price has been kept below 1.241 consistently for the past few trading hours, but managed to rally stronger just before Singapore midday. However price formed a gravestone Doji above the 1.241 level, with a bearish candle currently underway. A potential Evening Star pattern can be formed should the bearish candle close. Preferably price will be able to break the rising trendline, which will be in line with a break of 1.24 round number. An even better confirmation for the Evening Star confirmation will see price trading below the initial rally found 2 hours ago – whose base is also the confluence with the interim support around 1.2395. A push below the interim support will open back 1.233 as ultimate bearish target without necessary negating current rally from 9th May low.
Stochastic readings hints at a potential bearish reversal as well, with readings looking likely to form a top now, adding more weight to a bearish scenario should it be confirmed.
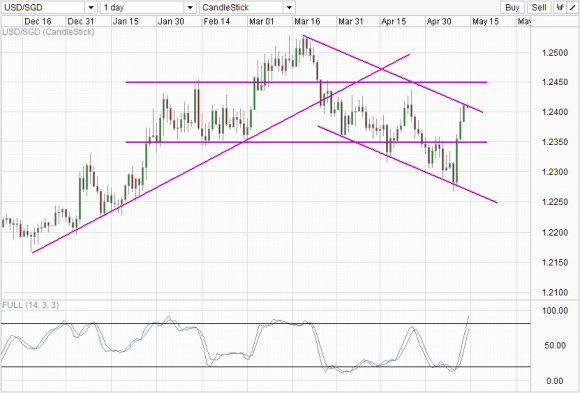
Daily Chart USD/SGD - 2" title="USD/SGD - 2" width="580" height="393">
Price is currently trading at the top of a new potential Channel on the Daily just as readings are entering the overbought region steeply. However, it is difficult to determine the relevance of this newly formed Channel until price has rebounded from current levels as there are basically no topside reference. This Channel is drawn using reference from the bottom trendline which can be reliably taken, and transposing it higher from Mar Highs, where the decline all began.
Speaking of the decline, the Head and Shoulders pattern with Feb consolidation as the Left Shoulder, March range as Head and April consolidation as Right Shoulder is still in play. Prices would need to successfully break April highs and preferably 1.245 in order for strong bullish bias to be established, which will put advantage still firmly on the bears side for a move towards Channel Bottom (if the channel is of any relevance to begin with).
Fundamentally, SGD isn’t expected to move wildly from here with next MAS monetary policy meeting a good 5 months away. There aren’t any important economic data releases from Singapore for the next couple of weeks either, voiding SGD any fundamental drivers in the near future. Hence USD is expected to play a large role in USD/SGD direction at least in the near future. With that in mind, a USD pullback may occur soon if we take into consideration that US stocks bulls are looking slightly weary now with Futures trading lower. Keep a lookout for US economic news moving forward as that could exacerbate any bearish pullback, and bring USD/SGD lower in line with what Technicals are potentially showing.
- English (UK)
- English (India)
- English (Canada)
- English (Australia)
- English (South Africa)
- English (Philippines)
- English (Nigeria)
- Deutsch
- Español (España)
- Español (México)
- Français
- Italiano
- Nederlands
- Português (Portugal)
- Polski
- Português (Brasil)
- Русский
- Türkçe
- العربية
- Ελληνικά
- Svenska
- Suomi
- עברית
- 日本語
- 한국어
- 简体中文
- 繁體中文
- Bahasa Indonesia
- Bahasa Melayu
- ไทย
- Tiếng Việt
- हिंदी
USD/SGD Technicals: Potential Evening Star Spotted On Hourly
Published 05/13/2013, 03:05 AM
Updated 07/09/2023, 06:31 AM
USD/SGD Technicals: Potential Evening Star Spotted On Hourly
Latest comments
Loading next article…
Install Our App
Risk Disclosure: Trading in financial instruments and/or cryptocurrencies involves high risks including the risk of losing some, or all, of your investment amount, and may not be suitable for all investors. Prices of cryptocurrencies are extremely volatile and may be affected by external factors such as financial, regulatory or political events. Trading on margin increases the financial risks.
Before deciding to trade in financial instrument or cryptocurrencies you should be fully informed of the risks and costs associated with trading the financial markets, carefully consider your investment objectives, level of experience, and risk appetite, and seek professional advice where needed.
Fusion Media would like to remind you that the data contained in this website is not necessarily real-time nor accurate. The data and prices on the website are not necessarily provided by any market or exchange, but may be provided by market makers, and so prices may not be accurate and may differ from the actual price at any given market, meaning prices are indicative and not appropriate for trading purposes. Fusion Media and any provider of the data contained in this website will not accept liability for any loss or damage as a result of your trading, or your reliance on the information contained within this website.
It is prohibited to use, store, reproduce, display, modify, transmit or distribute the data contained in this website without the explicit prior written permission of Fusion Media and/or the data provider. All intellectual property rights are reserved by the providers and/or the exchange providing the data contained in this website.
Fusion Media may be compensated by the advertisers that appear on the website, based on your interaction with the advertisements or advertisers.
© 2007-2025 - Fusion Media Limited. All Rights Reserved.