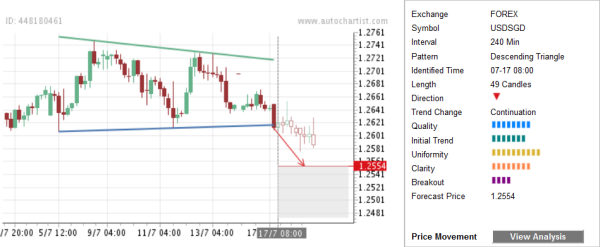
USD/SGD continues to decline after the recent completion of the high Quality Descending Triangle chart pattern identified on the 4-hour charts. The overall Quality of this chart pattern is rated at the 8 bar level as a result of the strong Initial Trend (7 bars), maximum Uniformity (10 bars) and substantial Clarity (8 bars). Maximum Uniformity of this chart pattern highlights the even distribution of the connecting points of the upper and the lower trendlines of this Descending Triangle. The completion of this chart pattern continues the overriding downtrend visible on the daily and the weekly USD/SGD charts. The pair is expected to fall further toward the Forecast Price 1.2554.
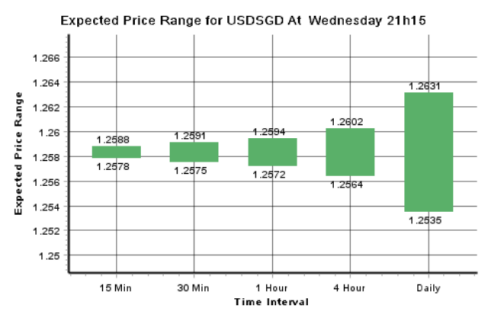
As can be seen from the PowerStats chart below, the lower boundary of the daily Expected Price Range calculated for USD/SGD (1.2535) stands below the Forecast Price calculated for the completion of the above Descending Triangle (1.2554) – which heightens the likelihood that USD/SGD will continue to fall toward this Forecast Price in the nearest time.
- English (UK)
- English (India)
- English (Canada)
- English (Australia)
- English (South Africa)
- English (Philippines)
- English (Nigeria)
- Deutsch
- Español (España)
- Español (México)
- Français
- Italiano
- Nederlands
- Português (Portugal)
- Polski
- Português (Brasil)
- Русский
- Türkçe
- العربية
- Ελληνικά
- Svenska
- Suomi
- עברית
- 日本語
- 한국어
- 简体中文
- 繁體中文
- Bahasa Indonesia
- Bahasa Melayu
- ไทย
- Tiếng Việt
- हिंदी
USD/SGD Declines After Completion Of High Quality Descending Triangle
Published 07/19/2012, 06:33 AM
Updated 03/09/2019, 08:30 AM
USD/SGD Declines After Completion Of High Quality Descending Triangle
Latest comments
Loading next article…
Install Our App
Risk Disclosure: Trading in financial instruments and/or cryptocurrencies involves high risks including the risk of losing some, or all, of your investment amount, and may not be suitable for all investors. Prices of cryptocurrencies are extremely volatile and may be affected by external factors such as financial, regulatory or political events. Trading on margin increases the financial risks.
Before deciding to trade in financial instrument or cryptocurrencies you should be fully informed of the risks and costs associated with trading the financial markets, carefully consider your investment objectives, level of experience, and risk appetite, and seek professional advice where needed.
Fusion Media would like to remind you that the data contained in this website is not necessarily real-time nor accurate. The data and prices on the website are not necessarily provided by any market or exchange, but may be provided by market makers, and so prices may not be accurate and may differ from the actual price at any given market, meaning prices are indicative and not appropriate for trading purposes. Fusion Media and any provider of the data contained in this website will not accept liability for any loss or damage as a result of your trading, or your reliance on the information contained within this website.
It is prohibited to use, store, reproduce, display, modify, transmit or distribute the data contained in this website without the explicit prior written permission of Fusion Media and/or the data provider. All intellectual property rights are reserved by the providers and/or the exchange providing the data contained in this website.
Fusion Media may be compensated by the advertisers that appear on the website, based on your interaction with the advertisements or advertisers.
© 2007-2025 - Fusion Media Limited. All Rights Reserved.
