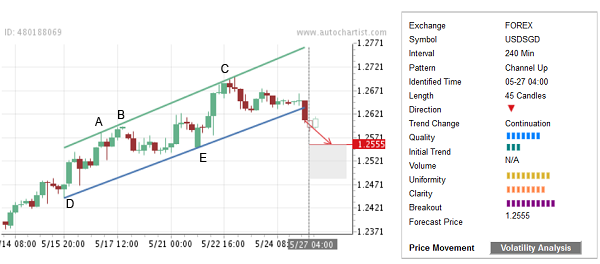
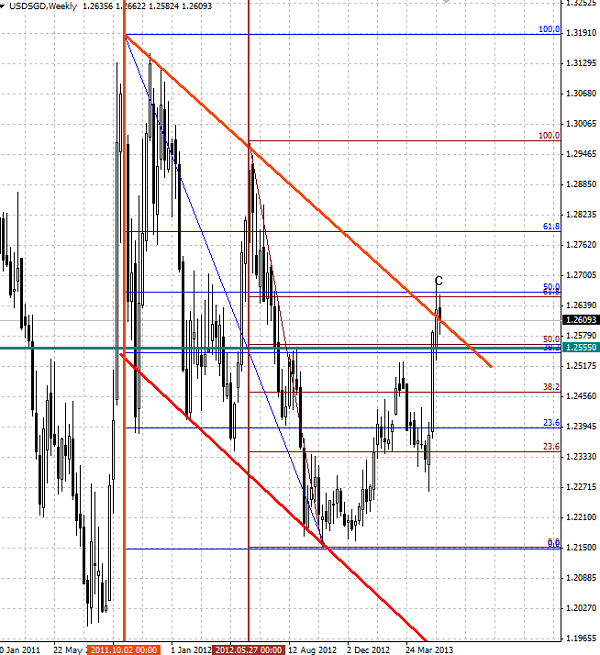
USD/SGD continues to decline after the recent breakout of the 4-hour Up Channel chart pattern identified recently by Autochartist. The overall Quality of this chart pattern is measured at the 7-bar level as a result of the lower Initial Trend (measured at the 3 bar level), near-maximum Uniformity (9 bars) and significant Clarity (8 bars). The top of this Up Channel (point C on the chart below) formed recently when the pair corrected down from the strong resistance area made out of the resistance trendline of the weekly Down Channel from November of 2010 and the cluster of the Fibonacci Retracements lying at the intersection of the 61,8% Fibonacci Retracement of the preceding downward price impulse from May of 2012 and the 50% Fibonacci Correction of the longer–term downward price move from the start of the aforementioned weekly Down Channel (as you can see on the second chart below). The pair is expected to fall toward the Forecast Price 1.2555 in the nearest time.

The following weekly USD/SGD chart shows the aforementioned resistance levels:
 USD/SGD" title="USD/SGD" width="600" height="655" />

The following weekly USD/SGD chart shows the aforementioned resistance levels:
 USD/SGD" title="USD/SGD" width="600" height="655" />