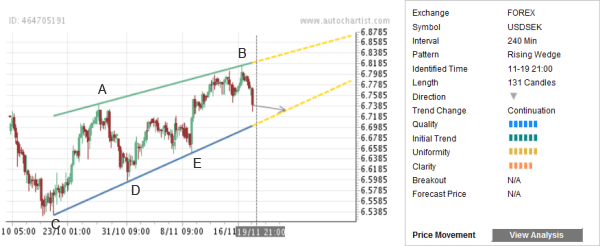
USD/SEK continues to decline inside the Rising Wedge chart pattern identified by Autochartist on the 4-hour charts. The overall Quality of this chart pattern is measured at the 6 bar level as a result of the equally rated Initial Trend and Uniformity and lower Clarity (5 bars). This chart pattern continues the preceding downward price impulse from June of 2012 – which recently broke the support trend line of the longer-term daily upward price channel from May of 2011.
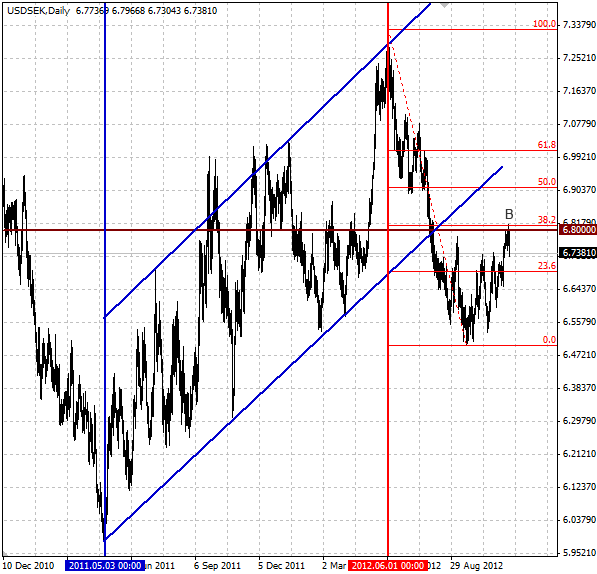
The top of this chart pattern (point B on the chart below) formed when the pair corrected down from the combined resistance zone made out of the resistance level 6.8000 (which corresponds to the breakout level of the aforementioned upward price channel from 2011) and the 38.2% Fibonacci Retracement of the preceding downward price thrust from June. The pair is expected to fall further toward the lower support trend line of this chart pattern.

The following daily USD/SEK chart shows the resistance price levels mentioned above:

The top of this chart pattern (point B on the chart below) formed when the pair corrected down from the combined resistance zone made out of the resistance level 6.8000 (which corresponds to the breakout level of the aforementioned upward price channel from 2011) and the 38.2% Fibonacci Retracement of the preceding downward price thrust from June. The pair is expected to fall further toward the lower support trend line of this chart pattern.

The following daily USD/SEK chart shows the resistance price levels mentioned above:

