
The US Dollar has been the absolute dominator, attracting the most buying flows in the currency market in the last 24h. Amid the absence of fundamental drivers this week, to understand what's been the catalyst of its ascendancy this week, we need to resort to the information I am getting from various institutional source
Date: 3/29/19
The Daily Edge is authored by Ivan Delgado, Market Insights Commentator at Global Prime. The purpose of this content is to provide an assessment of the market conditions. The report takes an in-depth look of market dynamics, factoring in fundamentals, technicals, inter-market in order to determine daily biases and assist one’s decisions on a regular basis. Feel free to follow Ivan on Twitter & Youtube.
Quick Take
The US Dollar has been the absolute dominator, attracting the most buying flows in the currency market in the last 24h. Amid the absence of fundamental drivers this week, to understand what's been the catalyst of its ascendancy this week, we need to resort to the information I am getting from various institutional sources. The buying interest back into the USD appears to be a function of US investors running to the exits in their foreign holdings, which has led to strong flows of currency repatriation into USD-denominated assets, which also helps to explain why the demand towards US fixed income has been so savage as of late. On the opposite side, we find the NZD, still lagging way behind the rest of the G10 FX pack in response to the new easing bias adopted by the RBNZ, while the GBP miseries are still present, with the currency finally giving in and adjusting its value lower as investors keep losing their patience amid the lack of any meaningful progress in Brexit. Talking about meaningful, another vote for UK PM May's Brexit deal is scheduled this Friday. Then we have the Loonie, the Yen, as a group of currencies having shown strength as of yet, the former inspired by the recent gains in Oil prices, while the latter still acts as a harbor to protect one's profile after the recent episodes of risk-off. I would then classify the Euro and the Aussie as the 2 currencies caught in the middle of the cross-current, with an outlook that keeps worsening for both of them. In the case of the Aussie, the move by the RBNZ may force the RBA to act more aggressively by shifting to a more dovish forward guidance, while the Euro still pays the consequences of the disastrous German PMI sub 45 from last Friday.

Key Narratives in Financial Markets
- The state of disarray in the Brexit saga is not getting any better, with disheartened investors now having to witness yet another attempt (3rd time) by UK PM Theresa May to table her withdrawal agreement back to the House of Commons on Friday evening UK time.
- UK’s May deal will be brought back after no consensus found in the 8 indicative votes on Wednesday, which were meant to evaluate the possible alternatives out of the Brexit mess. There will be further indicative votes next week to try to find new options in a way forward.
- This week, and I hope doesn’t set a precedent, most of the volatility has been centered around the GBP as the market tries to come up with a clearer narrative of the Brexit tail risks, while a sporadic episode of strong vol was also seen in the Kiwi on the back of a dovish RBNZ. The rest of G10 FX has been experiencing low interest, with the US Dollar so far the king.
- President Trump’s latest tweet storm, once again, had as a target OPEC+, suggesting that it’s about time that the cartel pumps more supply of Oil into the market. The news had only a marginal effect on the price of Oil, the same applies to the CAD.
- Fed Vice Chair Richard Clarida re-emphasized that the US is no more vulnerable to external shocks emanating from Brexit, global recessionary pressures or trade tensions. If these risks were to materialize, the Fed would be ready to cut rates, Clarida said. But with almost two rate cuts priced in by Q1 2020, it’s hard to see how those headlines justifies a negative to latch on.
- White House Economic Advisor Larry Kudlow gave a speech in which he seemed to try to steer the rhetoric about the US-China trade deal from time to policy-dependent, in other words, he is essentially saying don’t be surprised if further delays occur before coming to an agreement. Kudlow was clear in his words, noting that “if it takes a few more weeks, or if it takes months, so be it.” US Treasury Secretary Mnuchin and US Trade Representative Lighthizer are scheduled to hold trade talks in Beijing today, while next week, Chinese Vice Premier Liu will visit Washington to meet with US President Trump.
Recent Economic Indicators & Events Ahead

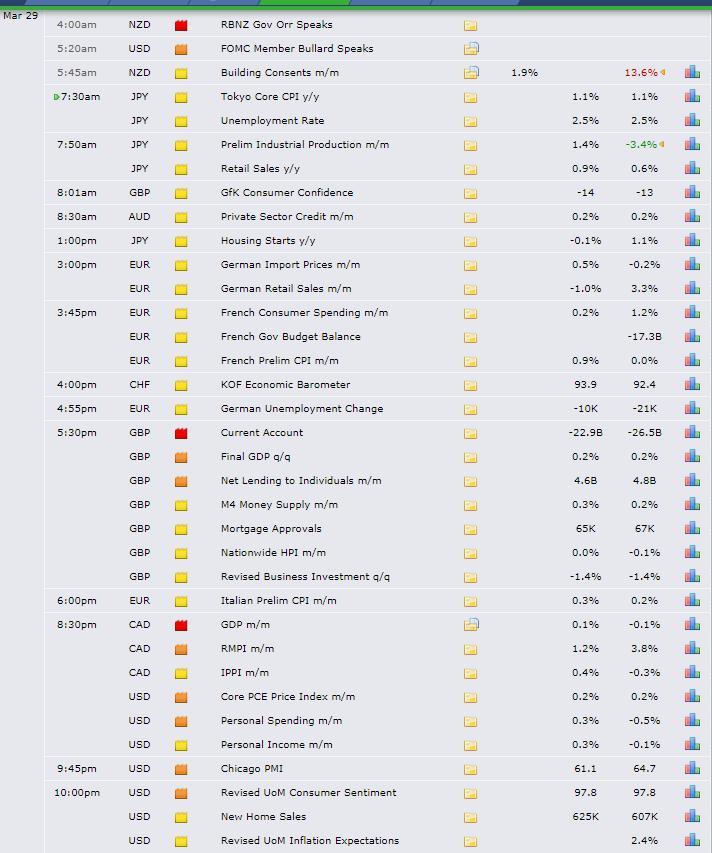
Source: Forexfactory
RORO - Risk On Risk Off Conditions


US equities found further buying interest sub 2,800, which raises the prospects of a potential double bottom if the market can achieve a successful rotation by breaking through the recent swing high of 2,835.00, with subsequent acceptance the final pre-condition to reinforce the buying dynamics and hence the micro bullish trend, which is already underway based on the slope of the 25HMA.
With regards to US yields, the mild recovery away from the multi-year low of 2.8% in the 30-yr appears to be driven by profit-taking of spec longs in US bonds than anything else. The downward slope of the 25HMA in the US30yr yield is still a clear reflection of a market still plagued with bearish sentiment, even if the fast and furious falls in global yields may now be entering a more balanced period.
Meanwhile, the strength in the DXY continues to be one of the main talking points, ongoing despite the dovish FOMC this month. But again, in the currency market, especially after the NZD selloff, which adds further pressure to ease by the RBA, it’s a race to the bottom, and amongst the basket of G10FX, the USD is still the least ugly.
Reflecting the sub-optimal state of the risk-averse flows, even based on Wednesday’s price action, was the inability of Gold to muster any gains despite we were still in a negative equity environment. What eventually transpired, amid the vigorous recovery in the USD, is a harsh selling of the metal.
According to Morgan Stanley (NYSE:MS), the decline of US sovereign bond yields and the advance of the USD has been predicated on the basis of US investors liquidating foreign asset holdings and investing these funds back into USD-denominated assets.
As the Strategy Team notes: “USD valuation swings are the result of net cross-border flows. While the appetite for foreign investment into the US is in a steep decline, US foreign asset holders have been repatriating at a faster pace, pushing net capital flows into the USD into positive territory. The message seems to be clear: as long as US-based investors repatriate at a faster pace than foreign investors reduce their investment flows into the US, the USD will remain bid.”

Overall, we seem to be transitioning into an environment of temporary USD strength across the board, in a context of rising equities, which tends to undermine the Japanese Yen as the clearest bet.
Summary: Intermarket Flows & Technical Analysis
EUR/USD: USD Repatriation Keeps Sellers In Control
US funds invested abroad have accelerated the repatriation flows into US bonds, which has caused funds back into USD-denominated assets. It continues to occur at a faster pace than foreign investors reducing investment flows into the US, hence the USD is still broadly bid. The price action in the exchange rate portrays these pressure as the price remains under a trendline that originated off March 22nd, time of the shocking German PMI under 45.00. The volume profile has printed yet another double distribution down with the price closing right around the same level as the POC, suggesting that value keeps building to print lower prices heading into Friday all else being equal. The bearish trend still looks like the path of least resistance, even if the German-US bond yield spread argues for an adjustment of the exchange rate into higher territory based on the divergence seen.


GBP/USD: Double Whammy Of Brexit & DXY Strength
The Sterling has been hit by the largest supply imbalance ever since March 21st, with the combination of Brexit jitters and ongoing repatriation of US-based investments abroad into USD-denominated assets, mainly into fixed income, allowing the bearish pressures to transpire. The one-way street move from Thursday has created a P-shaped volume profile, with most of the volume transacted left out at much higher levels circa 1.3150, reinforcing the sell on rallies strategy as the most sensible, an approach also congruent with the downward slopes in the DXY and UK-US bond yield spread. Expect diminished vol around the UK PM May’s vote to pass fer withdrawal deal if, as expected, it fails to gather enough support as that’s the outcome being clearly discounted.
, UK-US Yields")
, UK-US Yields")
USD/JPY: Recovery In Risk Flows Lifts The Rate
Blink and you missed it, that’s what speculators may have felt after the rapid appreciation of the exchange rate through early US hours. The ongoing buying interest in the DXY, in conjunction with rising equities and consolidation in the US yields, was sufficient to catapult the rate through the previous swing high, creating a successful rotation and a P-shaped volume profile in the process. Holding above 110.50 (POC + horizontal support) will be critically important to maintain the bullish momentum. Failure to do so may lead to the prospects of range bond dynamics to end the week. The fact that the successful rotation broke the prior highs marginally, even if the structure has been indeed violated, it puts into question the conviction of buyers to build up gains right off the bat. Taking intermarket analysis as our reference, at the time of writing, buy on weakness is favored.


AUD/USD: Low Interest To Trade The Pair
It’s evident by the limited fluctuation of the exchange rate that one needs to adapt his strategy to trade the micro moves in the Aussie if you are a short-term trader, or arm yourself with sufficient patience to let the slow grinding movements to play out over a longer time span. For now, we need to content ourselves with what might be a 35 pip range as our reference heading into Friday. That’s the tepid price extension we saw on Thursday, which in light of the single distribution day, suggests balanced flows may lead to buy and sell the edges for an extension of the range. A very uninspiring low key affair trading the pair this week, which clearly reflects the lack of drivers in the AUD this week, other than the impulsive selloff on the back of the RBNZ, where AUD piggybacked the NZD rout as expectations are building up for the RBA to adopt an easing bias in line with G10 Central Banks. By analyzing intermarket flows, with a stronger DXY, which has lead to a weaker Yuan, and the momentum in the AU-US bond yield spread turning negative, this is a market that remains with the risks skewed slightly towards the downside, even if the buying of equities caps the incentives a tad.


Important Footnotes
- Risk model: The fact that financial markets have become so intertwined and dynamic makes it essential to stay constantly in tune with market conditions and adapt to new environments. This prop model will assist you to gauge the context that you are trading so that you can significantly reduce the downside risks. To understand the principles applied in the assessment of this model, refer to the tutorial How to Unpack Risk Sentiment Profiles
- Cycles: Markets evolve in cycles followed by a period of distribution and/or accumulation. The weekly cycles are highlighted in red, blue refers to the daily, while the black lines represent the hourly cycles. To understand the principles applied in the assessment of cycles, refer to the tutorial How To Read Market Structures In Forex
- POC: It refers to the point of control. It represents the areas of most interest by trading volume and should act as walls of bids/offers that may result in price reversals. The volume profile analysis tracks trading activity over a specified time period at specified price levels. The study reveals the constant evolution of the market auction process. If you wish to find out more about the importance of the POC, refer to the tutorial How to Read Volume Profile Structures
- Tick Volume: Price updates activity provides great insights into the actual buy or sell-side commitment to be engaged into a specific directional movement. Studies validate that price updates (tick volume) are highly correlated to actual traded volume, with the correlation being very high, when looking at hourly data. If you wish to find out more about the importance tick volume, refer to the tutorial on Why Is Tick Volume Important To Monitor?
- Horizontal Support/Resistance: Unlike levels of dynamic support or resistance or more subjective measurements such as fibonacci retracements, pivot points, trendlines, or other forms of reactive areas, the horizontal lines of support and resistance are universal concepts used by the majority of market participants. It, therefore, makes the areas the most widely followed and relevant to monitor. The Ultimate Guide To Identify Areas Of High Interest In Any Market
- Trendlines: Besides the horizontal lines, trendlines are helpful as a visual representation of the trend. The trendlines are drawn respecting a series of rules that determine the validation of a new cycle being created. Therefore, these trendline drawn in the chart hinge to a certain interpretation of market structures.
- Correlations: Each forex pair has a series of highly correlated assets to assess valuations. This type of study is called inter-market analysis and it involves scoping out anomalies in the ever-evolving global interconnectivity between equities, bonds, currencies, and commodities. If you would like to understand more about this concept, refer to the tutorial How Divergence In Correlated Assets Can Help You Add An Edge.
- Fundamentals: It’s important to highlight that the daily market outlook provided in this report is subject to the impact of the fundamental news. Any unexpected news may cause the price to behave erratically in the short term.
- Projection Targets: The usefulness of the 100% projection resides in the symmetry and harmonic relationships of market cycles. By drawing a 100% projection, you can anticipate the area in the chart where some type of pause and potential reversals in price is likely to occur, due to 1. The side in control of the cycle takes profits 2. Counter-trend positions are added by contrarian players 3. These are price points where limit orders are set by market-makers. You can find out more by reading the tutorial on The Magical 100% Fibonacci Projection