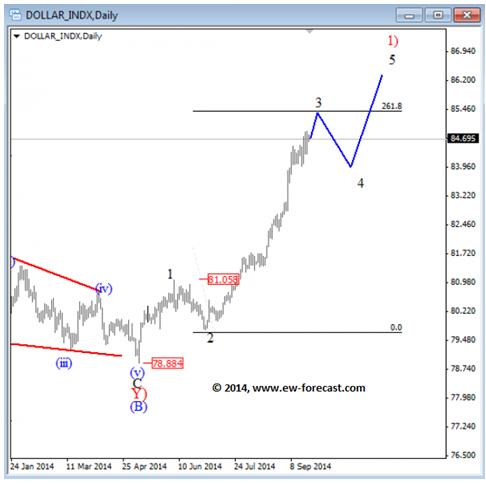
USD Index Daily
USD index is in bullish mode for the last couple of weeks from 78.90 where new count is showing the end of wave (B) so current rally can be a start of a big impulsive wave CC) from a weekly chart. As such, we believe that current bullish recovery represents an impulse in progress, currently with wave 3 still underway that can slow down around 85.00-85.50 area, at 261.8% Fibonacci extension of wave 1 measured from wave 2 low. We expect a deeper corrective retracement in wave 4 that could take place in October.

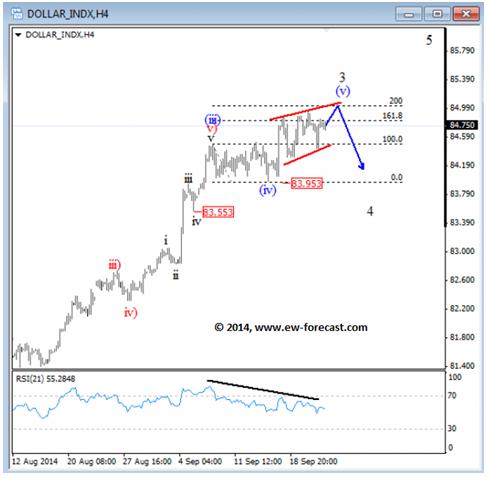
USD Index Four Hour
USD Index broke to a new high last week that we see it now as wave (v), final leg within wave 3 that can be looking for a top formation around 85.00 figure. We also see some overlapping and slow price action that can be an ending diagonal, but still unfolding. At the same time there is a bearish divergence on the RSI, which means that bullish momentum is decreasing so price is probably in late stages of wave three, thus corrective reversal can follow soon down into wave 4.
Courtesy: forecast.com

