Although the Fed is in the rate hike cycle, USD rally started to lose momentum early this year when market started to realize that monetary policy divergence started to narrow. ECB has started to talk about rate hikes, while China started to tighten monetary policy by raising money market rates early last month. The Fed also sounded less hawkish in their last rate hike as they forecasted only three rate hikes this year and no Fed members agreed to hike rate four times.
US dollar long bets continued to be paired down after the Republican withdrew the bill on the American Health Care Act (AHCA) last Friday when it became clear that they did not have the minimum 215 votes to make it pass. The AHCA was advocated by Trump and supposed to be the replacement for Obama’s Affordable Care Act (Obamacare). Trump’s opposition from his own party has cast doubt to his ability to deliver on other priorities and also his plan to reduce $350 billion in the coming 10 years.
In the past year, Trump’s campaign promise including tax reforms, infrastructure spending, and border-adjusted tax system has generated inflation and growth bets, dubbed as “Trump trade”, and these are supportive factors for the U.S dollar. AHCA is the first litmus test on Trump’s ability to fulfill his promise and the failure of to pass this proposal could presage the next item on the agenda.
With the original supportive factors for US dollar not realized in the short term and the Fed not hawkish enough, US Dollar may stay soft in the short term. These are the cited reasons for the recent U.S. dollar weakness, but does technical trading, specifically Elliott Wave, help to anticipate it?
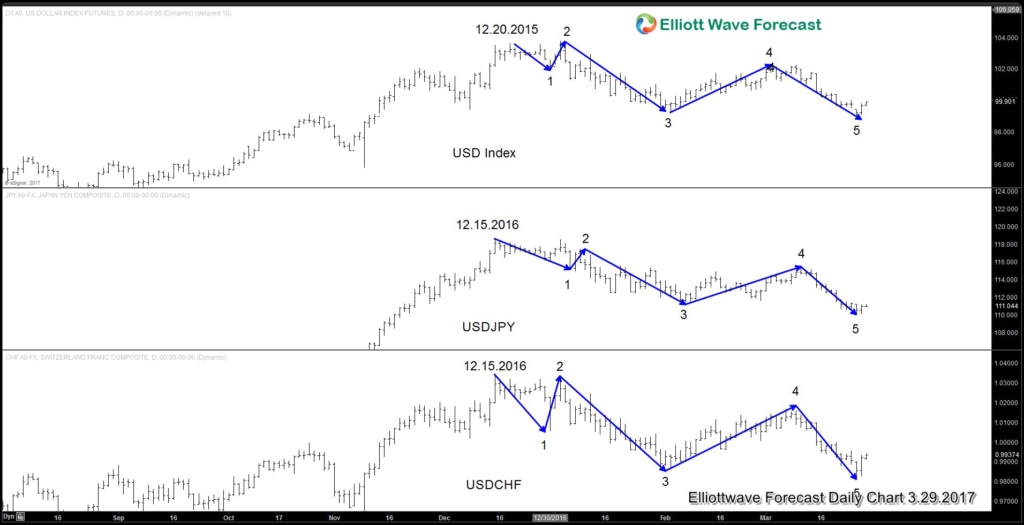
Daily Chart Overlay of USD (DXY), USD/JPY, and USD/CHF 3.29.2017
A technical look at US dollar index and two major USD Pairs (USD/JPY and USD/CHF) above suggest they show a 5 swing sequence from 12.15.2015 peak, favoring more downside. Please note that this is not the same with 5 waves impulse or diagonal, but this is a swing count (sequence) that we use at Elliott Wave Forecast. Any bounce in USD pair now ideally stays below March 9 peak for another leg lower. Thus technical outlook suggests that US dollar may stay soft in the near term.
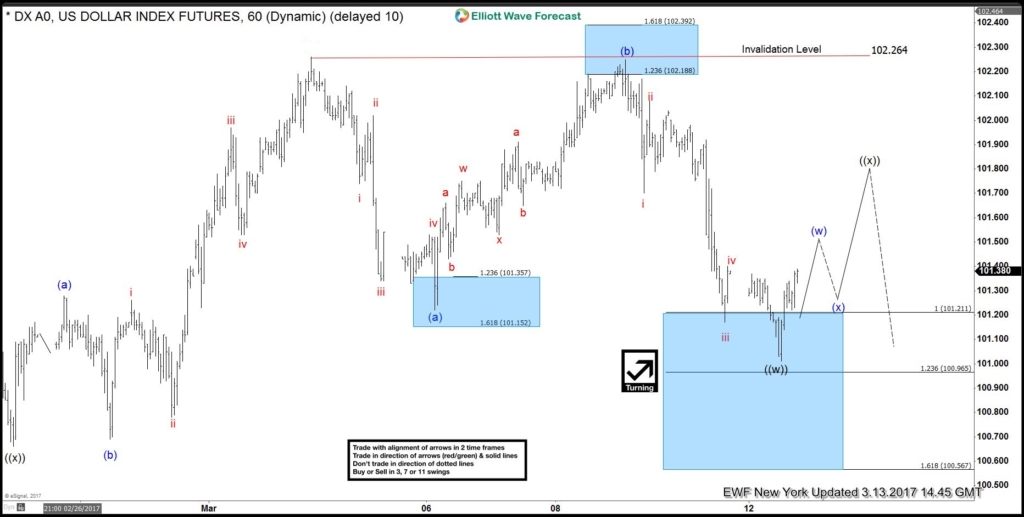
The fifth swing in the chart above however is formed after the Fed’s meeting and also after the Republican decision to withdraw the healthcare bill. How about before the events? Through Elliott Wave, intermarket analysis, sequence and distribution analysis, we’ve been able to identify US dollar weakness prior to the Fed’s rate decision and communicated to our members. Below is 1 hour chart prior to the Fed’s meeting.
1 Hour DXY New York Chart 3.13.2017
This suggests that a good reading of technical charts can anticipate a move without depending on the outcome of important news events. In addition, technical trading also provides a risk management mechanism that could not be done otherwise.
