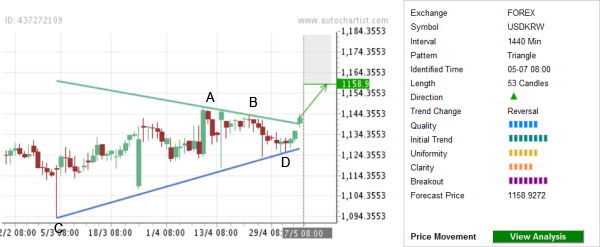
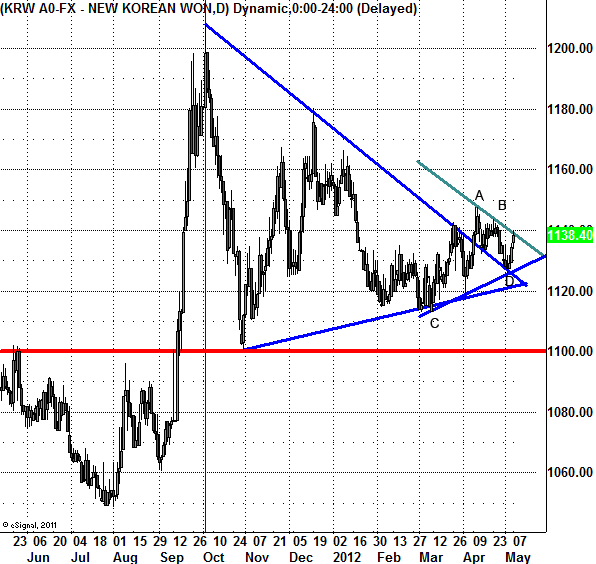
USD/KRW continues to rise after the recent completion of the Triangle chart pattern identified on the daily charts. The overall quality of this chart pattern is measured at the 6 bar level which reflects the following values of the individual contributing Quality indicators: strong Initial Trend (rated at the 8 bar level), above-average Uniformity (6 bars) and lower Clarity (5 bars). The completion of this Triangle reverses the preceding longer-term downward correction (which developed inside the larger weekly Triangle visible on the second chart below) to the preceding sharp weekly upward price impulse from major support at 1100.00.
The first upward price impulse of this Triangle (from C to A) broke through the descending resistance trendline of the aforementioned longer-term Triangle. The last connecting point of the lower support trendline of this Triangle (point D on the chart below) formed when the pair reversed from the previously broken resistance trendline – acting as support now. The pair is expected to rise further toward the Forecast Price 1158.9272.
The following daily USD/KRW chart demonstrates the aforementioned technical price levels:
Which stock should you buy in your very next trade?
With valuations skyrocketing in 2024, many investors are uneasy putting more money into stocks. Unsure where to invest next? Get access to our proven portfolios and discover high-potential opportunities.
In 2024 alone, ProPicks AI identified 2 stocks that surged over 150%, 4 additional stocks that leaped over 30%, and 3 more that climbed over 25%. That's an impressive track record.
With portfolios tailored for Dow stocks, S&P stocks, Tech stocks, and Mid Cap stocks, you can explore various wealth-building strategies.
