
Talking Points
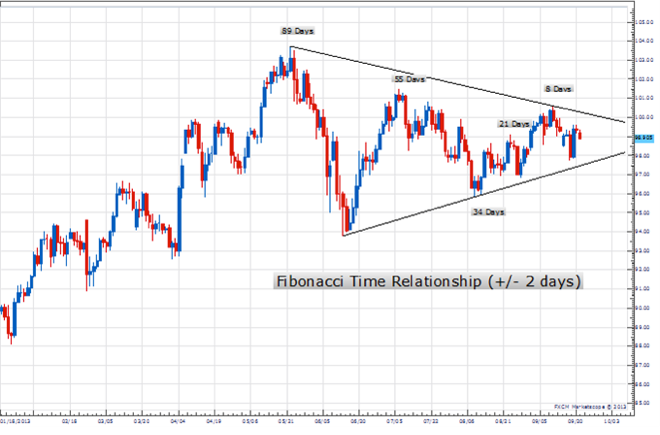
- Fibonacci time relationship in USD/JPY hints at potential breakout
- EUR/USD stalls at important Gann resistance
- Gold backs off from key Fibo
 USD/JPY" width="660" height="435">
USD/JPY has been locked in a clear narrowing range or “triangle” since late May. When the exchange rate will breakout (or down) from this pattern is the million dollar question in FX at the moment. In doing our analysis for the weekly on Friday we noticed that a simple daily bar count shows that a potential Fibonacci time relationship exists over the next few days with several of the key swing highs and lows of the past four months. In the past, we have noticed that when such bar count relationships emerge in a triangle formation they often times lead to a break from the broader consolidation. With USD/JPY nearing the apex of its multi-month triangle we would not be surprised to see some sort of expansion in volatility occur over the next few days during this window. The key pivot levels of the triangle look to be 100.30 and 97.50.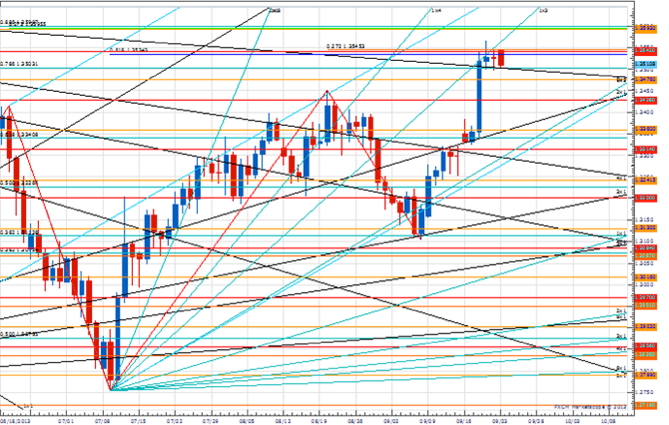 EUR/USD" width="669" height="425">
- EUR/USDtouched its highest level since February late last week before entering into consolidation mode below the 7thsquare root progression of the year’s low at 1.3540
- While above the 2ndsquare root progression of last week’s high at 1.3335 our near-term trend bias will remain higher
- The 1.3540 level is a clear upside pivot with traction above needed to setup a push towards attractions at 1.3600 and 1.3655
- A very minor cycle turn window is seen today
- Interim support is at 1.3475, but only weakness on a daily closing basis below 1.3335 would undermine the positive tone in the rate and turn us negative
EUR/USD Strategy: Like the long side while over 1.3335. EUR/USD: Technicals" width="678" height="46">
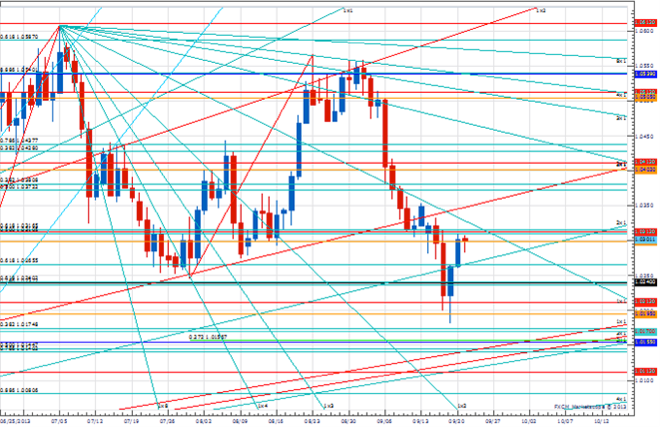 USD/CAD" width="664" height="427">
- USD/CAD fell to its lowest level in over two-months last week before finding support just below the 4thsquare root progression of the year-to-date high at 1.0195
- Our near-term trend bias remains lower in the exchange rate while below the 1x1 Gann angle line of the year’s high near 1.0330
- Weakness below 1.0195 is needed to trigger a much more important decline
- The middle of the week is a clear medium-term cycle turn window
- A daily close over 1.0330 would warn that Funds has bottomed ahead of schedule
USD/CAD Strategy: Like the short side while below 1.0330. USD/CAD: Technicals" width="688" height="59">
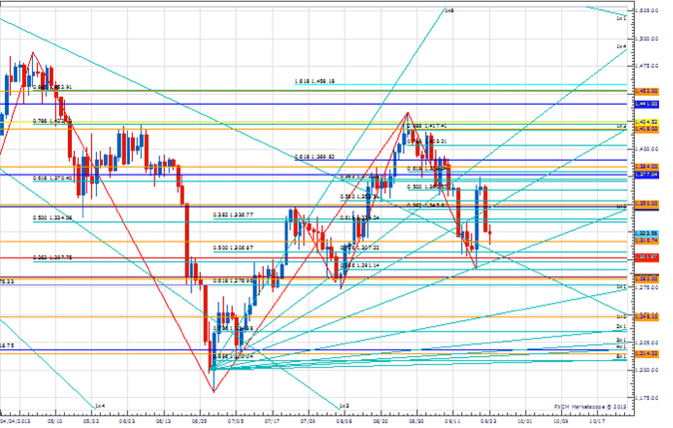
- XAU/USDrebound last week off the 1x1 Gann angle line of the year’s closing low has encountered strong resistance at the 61.8% retracement of the May to June decline near 1370
- While above 1290 our near-term trend bias will remain higher in the metal
- The 1370 level is now an important near-term upside pivot with strength above needed to re-instill upside momentum
- A medium-term cycle turn window is in effect over the next day or so
- A daily close below 1290 would turn the outlook negative
XAU/USD Strategy: Like the long side while above 1290. XAU/USD: Technicals" width="689" height="61">
-- by Kristian Kerr, Senior Currency Strategist for DailyFX.com
-- Charts Created using Marketscope – Prepared by Kristian Kerr