After taking a couple swipes at the 82.00 barrier, the USD/JPY broke through the round number with some vigor as the breakout bar had some good clearing distance from the prior ceiling to close last week. After Monday’s close, price action has formed and inside bar at the top of the range which we are taking as a trend continuation signal.
Notice how price held in the upper range of the prior breakout bar? This small inside bar likely represents some small profit taking or a small layer of resistance, but the USJPY has opened today being bought up from the open. Should price break the prior day’s high around 82.63, we will look to buy on this break targeting 83.50 and possibly 84.60. Only a break back below 81.30 would chance our short term bullish bias on the pair.
On the Fundamental Side:
It first should be noted we have an FOMC meeting tomorrow at the usual 2.15pm EST / 18.15pm GMT time. But shifting to the land of the rising sun, while Japan is still recovering and we are getting more and more of those details, we expect continued JPY weakness vs. the G8, but especially against the USD. Considering Japan has shut down all 54 of its nuclear plants leading to an energy insufficiency, a trade deficit that is in negative territory for the first time in decades, a budget deficit that is now 5% larger tahn revenues, a recession shrinking Japan’s economy at an annual rate of 2.3%, and (shall I say more…) a total debt standing at a ginormous 235% GDP, we don’t really see investors wanting to pile into JPY anytime soon. Oh, and don’t forget the stated attempts by the BOJ to debase the currency.
NZD/USD – Forms Pinbar and Higher Low
After selling off from the daily 20ema rejection we wrote about in our forex trade setups commentary last Thursday, price has formed a pinbar on the 4hr charts which many of our price action traders are currently long on. What we like about this pinbar is a combination of two things;
1) how it hit off a key level but formed a HL (higher low)
2) notice how the candles leading up to it got smaller and smaller?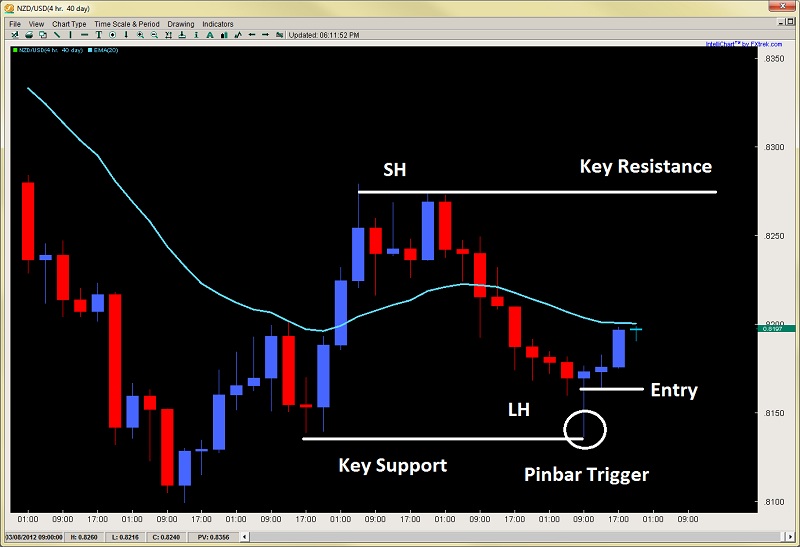 NZD/USD" title="NZD/USD" width="800" height="548">
This last part is communicating how the offers were getting absorbed by buyers as price declined, with the last 16hrs prior to the pinbar all forming downside wicks telling us buyers were there attempting to stop price, even though it was still declining. The pinbar price action forex trigger I think was the coup de grace and the bulls short term line in the sand. Since then, price has climbed for the last 8hrs with the last candle being bought up from the open, telling us strong buying pressure from the beginning to the end of the candle.
One last hurdle to release the upside is a break above the 4hr 20ema. Should price clear this, we expect a move back to .8260/75 whereby it will challenge the key resistance and prior SH (Swing High) there.
- English (UK)
- English (India)
- English (Canada)
- English (Australia)
- English (South Africa)
- English (Philippines)
- English (Nigeria)
- Deutsch
- Español (España)
- Español (México)
- Français
- Italiano
- Nederlands
- Português (Portugal)
- Polski
- Português (Brasil)
- Русский
- Türkçe
- العربية
- Ελληνικά
- Svenska
- Suomi
- עברית
- 日本語
- 한국어
- 简体中文
- 繁體中文
- Bahasa Indonesia
- Bahasa Melayu
- ไทย
- Tiếng Việt
- हिंदी
USD/JPY: Forming Inside Bar At Yearly Highs
Published 03/13/2012, 03:46 AM
Updated 05/14/2017, 06:45 AM
USD/JPY: Forming Inside Bar At Yearly Highs
Latest comments
Loading next article…
Install Our App
Risk Disclosure: Trading in financial instruments and/or cryptocurrencies involves high risks including the risk of losing some, or all, of your investment amount, and may not be suitable for all investors. Prices of cryptocurrencies are extremely volatile and may be affected by external factors such as financial, regulatory or political events. Trading on margin increases the financial risks.
Before deciding to trade in financial instrument or cryptocurrencies you should be fully informed of the risks and costs associated with trading the financial markets, carefully consider your investment objectives, level of experience, and risk appetite, and seek professional advice where needed.
Fusion Media would like to remind you that the data contained in this website is not necessarily real-time nor accurate. The data and prices on the website are not necessarily provided by any market or exchange, but may be provided by market makers, and so prices may not be accurate and may differ from the actual price at any given market, meaning prices are indicative and not appropriate for trading purposes. Fusion Media and any provider of the data contained in this website will not accept liability for any loss or damage as a result of your trading, or your reliance on the information contained within this website.
It is prohibited to use, store, reproduce, display, modify, transmit or distribute the data contained in this website without the explicit prior written permission of Fusion Media and/or the data provider. All intellectual property rights are reserved by the providers and/or the exchange providing the data contained in this website.
Fusion Media may be compensated by the advertisers that appear on the website, based on your interaction with the advertisements or advertisers.
© 2007-2025 - Fusion Media Limited. All Rights Reserved.