EUR/USD
The Euro recovered part of its last week losses, after finding footstep at 1.2357, last Friday’s low. Subsequent bounce, triggered by weaker than expected US jobs data, approaches 1.25 barrier, formed base, also near Fibonacci 61.8% retracement of 1.2576/1.2357 descend. Sentiment remains negative overall and favors fresh weakness after completing corrective phase, as the pair closed in red for the third consecutive week. Initial barrier lies at 1.2532 lower top of 6 Nov, reinforced by daily 10SMA. Close above here would sideline bears for test of 1.2576 breakpoint, 04 Nov lower top.
Res: 1.2500; 1.2532; 1.2565; 1.2576
Sup: 1.2450; 1.2410; 1.2395; 1.2357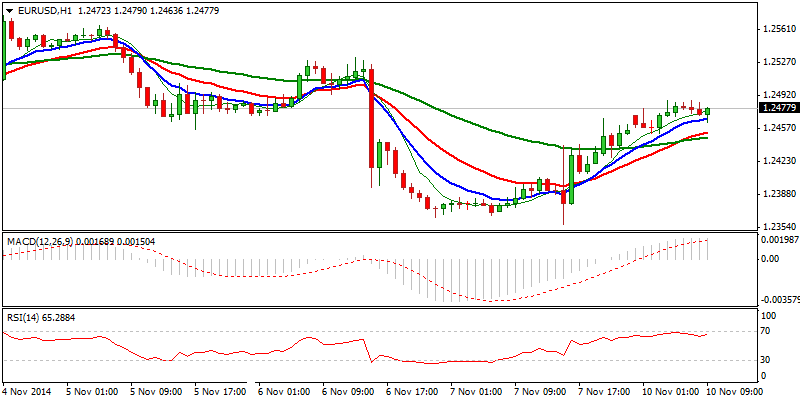
EUR/JPY
The pair trades in near-term consolidative phase, under fresh high at 144.20, with 142.20 zone, floor of two-day consolidation, being under pressure. Weak near-term technicals see further easing favored, with close below 142 handle, required to spark stronger correction. Next supports lay at 141.68 higher low of 04 Nov, 141.46, Fibonacci 38.2% of 137.02/144.20 upleg and 140.61, 50% retracement. On the other side, last Friday’s and weekly close, were positive, which could signal fresh upside after completion of shallow correction, ideally to be contained above 142 handle. Otherwise, stronger pullback could be expected on acceleration through psychological 140.00 support.
Res: 142.95; 143.43; 143.58; 144.00
Sup: 142.20; 142.00; 141.68; 141.46 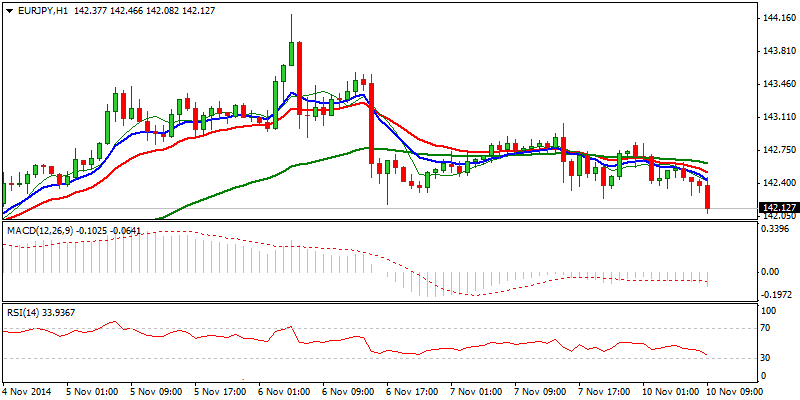
GBP/USD
The pair corrects recent losses, off 1.60 lower top, which found ground at 1.5788 for now. Last Friday’s positive close signals near-term corrective phase, however, overall picture remains bearish. Probe above 1.59 barrier, could signal further recovery, in case of close above, however, while key near–term hurdles at 1.6000, psychological resistance / daily Kijun-sen line and 1.6020 lower platform stay intact, lower top formation and fresh weakness scenario, will remain favored.
Res: 1.5919; 1.5953; 1.6000; 1.6020
Sup: 1.5870; 1.5840; 1.5814; 1.5788 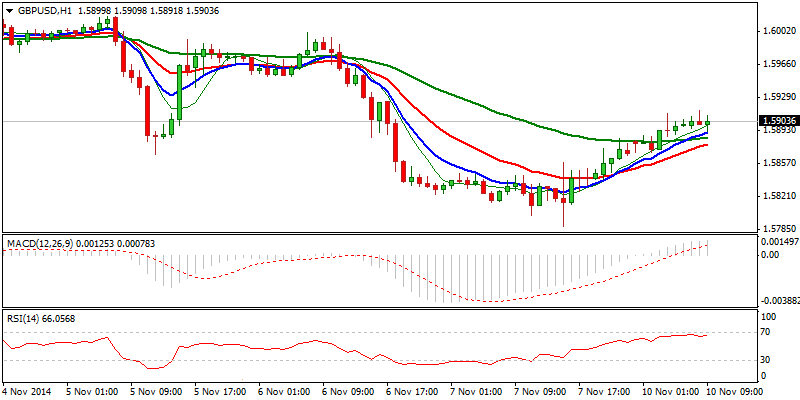
USD/JPY
Corrective easing from fresh highs at 115.50 zone, attacks114 support, following Friday’s negative close. Near-term studies are south-heading and suggest further easing, with the notion being supported by overbought larger timeframes studies and reversing daily indicators. Sustained break below 114 handle, to open 113.15/00 support zone, higher low of 04 Nov / Fibonacci 38.2% of 108.78/115.56 upleg, below which, last week’s low 112.56, offers next strong support. Key supports lay at 110 zone, previous highs and 109.50, broken long-term bear-trendline, connecting 2002/2007 peaks, loss of which to signal major reversal.
Res: 114.40; 115.00; 115.50; 116.00
Sup: 113.71; 113.15; 113.00; 112.56 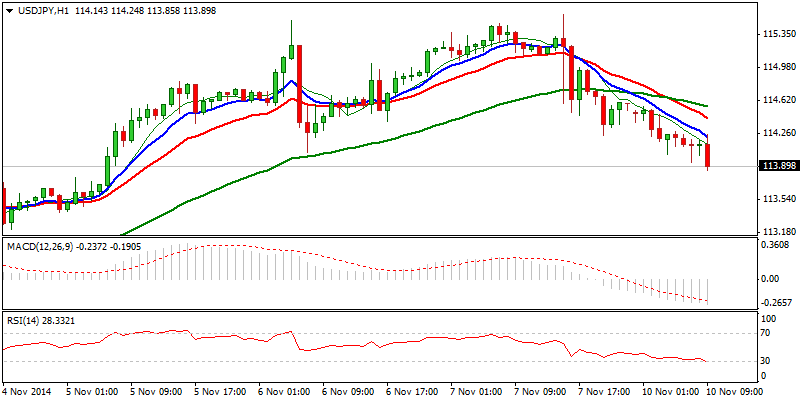
AUD/USD
The pair bounces off fresh low at 0.8539 and attacks double-Fibonacci barrier at 0.8680 zone, 38.2% of 0.8909/0.8539 descend and 61.8% retracement of 0.8760/0.8539 downleg. Friday’s bullish Outside Day, could be a signal of stronger bounce, in case the price breaks above 0.8760 lower platform and breakpoint, as daily MACD bullish divergence supports the notion. Otherwise, expect lower top formation and fresh weakness, in case of failure at 0.8760 barrier.
Res: 0.8680; 0.8700; 0.8760; 0.8800
Sup: 0.8620; 0.8600; 0.8565; 0.8539 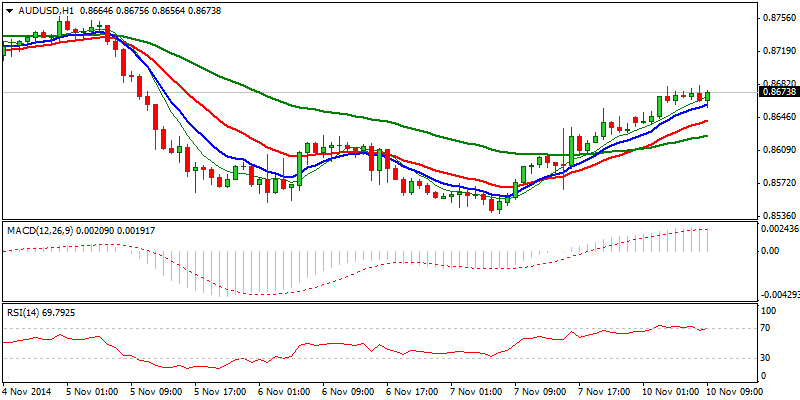
AUD/NZD
The pair trades in near-term consolidative mode, after cracking important 1.1100 level, psychological support / Fibonacci 61.8% of 1.0983/1.1301 upleg. Bounce from fresh low at 1.1088, is so far seen as corrective and preceding fresh push lower, as the price action holds below initial 1.1170/80 barrier, Fibonacci 38.2% of 1.1301/1.1088 / lower platform and near-term studies are negative. Sustained break below 1.11 handle, also daily cloud top, to open way for further easing and signal triple-top formation on 1.13 zone. Fibonacci 38.2% of 1.0619/1.1301 ascend at 1.1040, offers the next support, ahead of psychological 1.10 level, also 100SMA and higher base at 1.0980. Alternative scenario requires break and close above 1.12 barrier, near mid-point of 1.1301/1.1088 downleg, to sideline downside risk.
Res: 1.1170; 1.1182; 1.1200; 1.1220
Sup: 1.1100; 1.1088; 1.1040; 1.1000 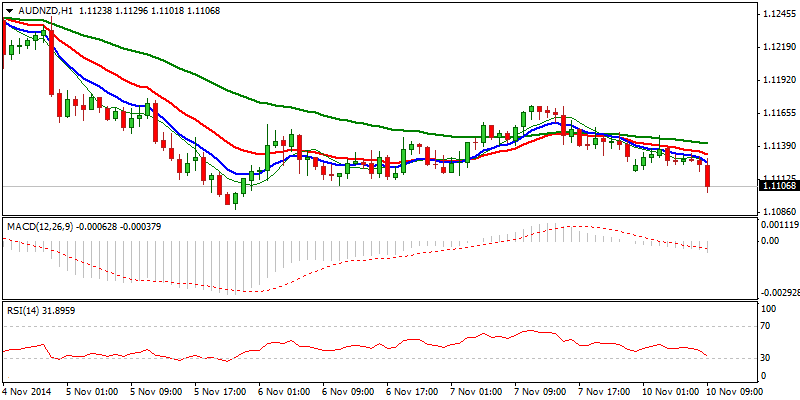
XAU/USD
Near-term studies have improved, as the price rallied off fresh low at 1131 and took out important barriers at 1161/74, previous consolidation boundaries. Rally so far peaked at 1176, Fibonacci 38.2% retracement of 1255/1131 descend, where the price entered near-term consolidative phase, before attack at previous critical support, now resistance at 1182, above which to signal further recovery and sideline short-term bears. Last Friday’s long green candle and weekly Hammer, support the notion. Consolidation low at 1168, offers initial support and holds for now, ahead 1161, previous resistance and Fibonacci 38.2% of 1131/1179 rally.
Res: 1179; 1182; 1193; 1200
Sup: 1168; 1161; 1155; 1150 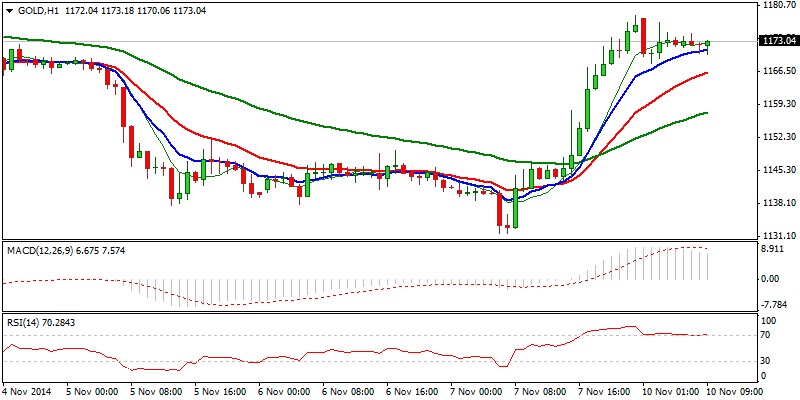
- English (UK)
- English (India)
- English (Canada)
- English (Australia)
- English (South Africa)
- English (Philippines)
- English (Nigeria)
- Deutsch
- Español (España)
- Español (México)
- Français
- Italiano
- Nederlands
- Português (Portugal)
- Polski
- Português (Brasil)
- Русский
- Türkçe
- العربية
- Ελληνικά
- Svenska
- Suomi
- עברית
- 日本語
- 한국어
- 简体中文
- 繁體中文
- Bahasa Indonesia
- Bahasa Melayu
- ไทย
- Tiếng Việt
- हिंदी
USD/JPY: Corrective Easing From Fresh Highs At 115.50 Zone
Published 11/10/2014, 04:48 AM
Updated 02/21/2017, 08:25 AM
USD/JPY: Corrective Easing From Fresh Highs At 115.50 Zone
Latest comments
Loading next article…
Install Our App
Risk Disclosure: Trading in financial instruments and/or cryptocurrencies involves high risks including the risk of losing some, or all, of your investment amount, and may not be suitable for all investors. Prices of cryptocurrencies are extremely volatile and may be affected by external factors such as financial, regulatory or political events. Trading on margin increases the financial risks.
Before deciding to trade in financial instrument or cryptocurrencies you should be fully informed of the risks and costs associated with trading the financial markets, carefully consider your investment objectives, level of experience, and risk appetite, and seek professional advice where needed.
Fusion Media would like to remind you that the data contained in this website is not necessarily real-time nor accurate. The data and prices on the website are not necessarily provided by any market or exchange, but may be provided by market makers, and so prices may not be accurate and may differ from the actual price at any given market, meaning prices are indicative and not appropriate for trading purposes. Fusion Media and any provider of the data contained in this website will not accept liability for any loss or damage as a result of your trading, or your reliance on the information contained within this website.
It is prohibited to use, store, reproduce, display, modify, transmit or distribute the data contained in this website without the explicit prior written permission of Fusion Media and/or the data provider. All intellectual property rights are reserved by the providers and/or the exchange providing the data contained in this website.
Fusion Media may be compensated by the advertisers that appear on the website, based on your interaction with the advertisements or advertisers.
© 2007-2025 - Fusion Media Limited. All Rights Reserved.
