The curious case of USD continued yesterday. US stocks rallied strongly against the flow of global equities where losses were seen from both Asian and European major indexes, but that did not invoke a stronger USD which was the norm for the past 2 months. Instead, USD weakened in similar fashion circa 2009-2012, where a rally in stocks (or increase in risk appetite) pushed USD (safe haven) weaker. Unfortunately for USD/JPY bulls, this was not what they want to see as the weakening USD allowed Yen to push USD/JPY below the 100.0 level – first time price has breached it since clearing it on 10th May.
Hourly Chart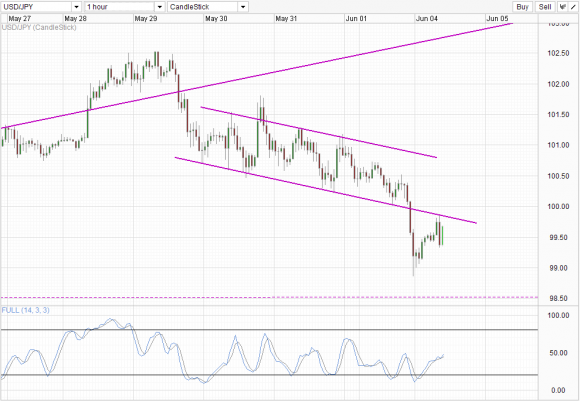 USD/JPY_1" title="USD/JPY_1" width="580" height="401">
From the Hourly Chart, we can see that price found support around 99.0 during New York midday. Price rallied back up but failed to test 100.0, being stopped by the descending Channel bottom. The immediate rejection was strong, forming a bearish engulfing which broke the 99.50 interim support along the way – potentially forming a tweezers top. However that appears to be invalidated with a strong bullish candle currently underway, seeking to test the descending Channel bottom once more.
Despite current surprise bullishness, it remains difficult for price to break into the channel with Stochastic indicators showing the Stoch line entering the stoch “resistance band” around 50.0 where numerous peaks were seen previously. Nonetheless, should price do manage to clear the Descending Channel, the likelihood of breaking 100.0 increases, but that may not change the overall short-term bearish outlook unless 101.0 and Channel Top are broken.
Daily Chart
The same applies to longer term Daily Chart. Price is still mostly bullish despite trading below the rising trendline and clearing 100.0. Price will preferably need to trade below 97.0, breaking the April consolidation range to establish itself fully. Stochastic indicator shows the Stoch line rising, indicating a slowdown in bearish momentum. If price manage to climb back above 100.0 from here, it is likely that Stoch readings will cross Signal line and perhaps even clear the 20.0 level to signal the initial stages of a bullish cycle, which is in line with overall bullish trend that has been in play since Sep 2012.
With Bank of Japan meeting only coming next week, speculators will be free to continue buying Yen up this week as it is unlikely that Kuroda or any BOJ members will reveal any more new stimulus plan from now till next Monday. As such, USD/JPY is at the mercy of speculators wishing to push Yen lower due to the loss of confidence in BOJ/Abenomics, and also at the mercy of the USD weakening phenomenal. With regards to USD, it is important to continue watching the correlation with US Stocks, as 1 swallow doesn’t make a summer, and certainly 2 swallows (last Friday and yesterday) doesn’t do much better in terms of assuring us that the new negative correlation is here to stay for June. But certainly, if this relationship holds, and US stocks does manage to pull itself higher despite current global woes (not a tall order if NFP this Friday surprise on the upside), then a case for further USD/JPY bearish correction will grow louder.
- English (UK)
- English (India)
- English (Canada)
- English (Australia)
- English (South Africa)
- English (Philippines)
- English (Nigeria)
- Deutsch
- Español (España)
- Español (México)
- Français
- Italiano
- Nederlands
- Português (Portugal)
- Polski
- Português (Brasil)
- Русский
- Türkçe
- العربية
- Ελληνικά
- Svenska
- Suomi
- עברית
- 日本語
- 한국어
- 简体中文
- 繁體中文
- Bahasa Indonesia
- Bahasa Melayu
- ไทย
- Tiếng Việt
- हिंदी
USD/JPY: Bearish Rejection Below 100.0
Published 06/04/2013, 03:31 AM
Updated 07/09/2023, 06:31 AM
USD/JPY: Bearish Rejection Below 100.0
Latest comments
Loading next article…
Install Our App
Risk Disclosure: Trading in financial instruments and/or cryptocurrencies involves high risks including the risk of losing some, or all, of your investment amount, and may not be suitable for all investors. Prices of cryptocurrencies are extremely volatile and may be affected by external factors such as financial, regulatory or political events. Trading on margin increases the financial risks.
Before deciding to trade in financial instrument or cryptocurrencies you should be fully informed of the risks and costs associated with trading the financial markets, carefully consider your investment objectives, level of experience, and risk appetite, and seek professional advice where needed.
Fusion Media would like to remind you that the data contained in this website is not necessarily real-time nor accurate. The data and prices on the website are not necessarily provided by any market or exchange, but may be provided by market makers, and so prices may not be accurate and may differ from the actual price at any given market, meaning prices are indicative and not appropriate for trading purposes. Fusion Media and any provider of the data contained in this website will not accept liability for any loss or damage as a result of your trading, or your reliance on the information contained within this website.
It is prohibited to use, store, reproduce, display, modify, transmit or distribute the data contained in this website without the explicit prior written permission of Fusion Media and/or the data provider. All intellectual property rights are reserved by the providers and/or the exchange providing the data contained in this website.
Fusion Media may be compensated by the advertisers that appear on the website, based on your interaction with the advertisements or advertisers.
© 2007-2025 - Fusion Media Limited. All Rights Reserved.