USD/JPY Near-Term Outlook
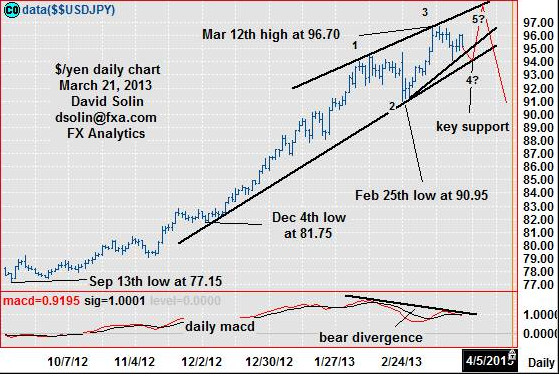
The market is seen in process of forming a large rising wedge since Feb, generally viewed as a reversal pattern that resolves lower (at times sharply). These patterns will often occur after sharp moves (longs start to liquidate on further highs, those who missed the move look to buy at lower levels), and along with an overbought market after the last months of sharp gains and technicals (which are not confirming the recent upside, see bearish divergence on the daily macd at bottom of chart below) add to this view of an approaching top (for at least a month or more)/possible rising wedge. However, wedges break down to 5 waves, leaving open scope for another week or more of trading within in the pattern, and potentially even further highs above the Mar 12th 96.70 (see "ideal" scenario in red on daily chart below). Nearby support is seen at the bullish trendline from late Feb (currently at 94.65/80) and the base of the wedge/bullish trendline from Nov (currently at 93.55/70). Resistance is seen at 96.05/15, the 96.70 high, and the ceiling of the wedge (currently at 97.70/85).
Strategy/Position
With scope for another week (or more) of ranging with an upward bias, want to trade from the long side and would buy here (currently at 95.05). Initially stop on a close below the base of the potential rising wedge (currently at 93.60/70), but getting more aggressive on nearby gains and especially an approach (and break) of the 96.70 high (to compensate for the risk of further, limited gains).
Long-Term Outlook
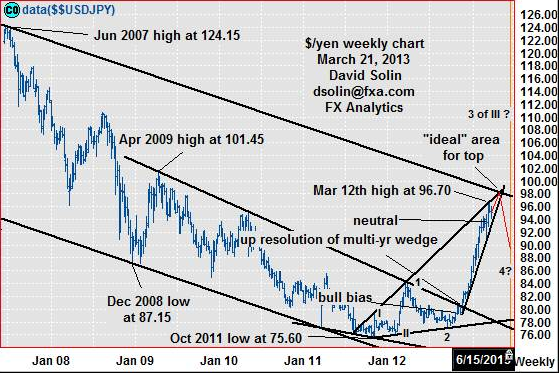
The market has indeed continued to surge virtually non-stop after the Nov upside resolution of the long discussed 31/2-year falling wedge (then near 80.50, see weekly chart/2nd chart below, warned that these patterns resolve sharply). Remain a long term bull (out the next 9-12 months or more), and with gains toward the long held 99.75/00 (50% retracement from the Jun 2007 high at 124.15) and above, still favored. But as mentioned above, scope is rising for at least a month of correcting lower. Note too that lots of resistance lies just above the 96.70 high at the rising trendline from Nov 2011 (currently at 97.15/40) and the ceiling of the bearish channel from Jun 2007 (currently at 98.75/00), which are both converging rapidly, and provide an "ideal" area at higher levels to complete a more important top (see "ideal" scenario in red on weekly chart/2nd chart below). Finally from an Elliott Wave perspective, the market is seen within wave 3 in the rally from the Feb 2012 low at 76.05, with this approaching few months of consolidating seen as a correction (wave 4) and with an eventual resumption of the gains to new highs after (within wave 5).
Strategy/Position
Finally switched the longer term bullish bias that was put in place way back on Oct 18th at 79.25 to neutral on the intra-day break of the multi-week wedge on Feb 25th at 92.95 (+ over 17%). Though further upside is favored, the magnitude is seen limited and not enough to warrant switching the longer term bias back to the bullish side here. So for now, would maintain the longer term neutral bias.

 USD/JPY: Daily" width="559" height="374" />
 USD/JPY: Weekly" width="559" height="373" />
The market is seen in process of forming a large rising wedge since Feb, generally viewed as a reversal pattern that resolves lower (at times sharply). These patterns will often occur after sharp moves (longs start to liquidate on further highs, those who missed the move look to buy at lower levels), and along with an overbought market after the last months of sharp gains and technicals (which are not confirming the recent upside, see bearish divergence on the daily macd at bottom of chart below) add to this view of an approaching top (for at least a month or more)/possible rising wedge. However, wedges break down to 5 waves, leaving open scope for another week or more of trading within in the pattern, and potentially even further highs above the Mar 12th 96.70 (see "ideal" scenario in red on daily chart below). Nearby support is seen at the bullish trendline from late Feb (currently at 94.65/80) and the base of the wedge/bullish trendline from Nov (currently at 93.55/70). Resistance is seen at 96.05/15, the 96.70 high, and the ceiling of the wedge (currently at 97.70/85).
Strategy/Position
With scope for another week (or more) of ranging with an upward bias, want to trade from the long side and would buy here (currently at 95.05). Initially stop on a close below the base of the potential rising wedge (currently at 93.60/70), but getting more aggressive on nearby gains and especially an approach (and break) of the 96.70 high (to compensate for the risk of further, limited gains).
Long-Term Outlook
The market has indeed continued to surge virtually non-stop after the Nov upside resolution of the long discussed 31/2-year falling wedge (then near 80.50, see weekly chart/2nd chart below, warned that these patterns resolve sharply). Remain a long term bull (out the next 9-12 months or more), and with gains toward the long held 99.75/00 (50% retracement from the Jun 2007 high at 124.15) and above, still favored. But as mentioned above, scope is rising for at least a month of correcting lower. Note too that lots of resistance lies just above the 96.70 high at the rising trendline from Nov 2011 (currently at 97.15/40) and the ceiling of the bearish channel from Jun 2007 (currently at 98.75/00), which are both converging rapidly, and provide an "ideal" area at higher levels to complete a more important top (see "ideal" scenario in red on weekly chart/2nd chart below). Finally from an Elliott Wave perspective, the market is seen within wave 3 in the rally from the Feb 2012 low at 76.05, with this approaching few months of consolidating seen as a correction (wave 4) and with an eventual resumption of the gains to new highs after (within wave 5).
Strategy/Position
Finally switched the longer term bullish bias that was put in place way back on Oct 18th at 79.25 to neutral on the intra-day break of the multi-week wedge on Feb 25th at 92.95 (+ over 17%). Though further upside is favored, the magnitude is seen limited and not enough to warrant switching the longer term bias back to the bullish side here. So for now, would maintain the longer term neutral bias.

 USD/JPY: Daily" width="559" height="374" />
 USD/JPY: Weekly" width="559" height="373" />