 USD/JPY_1" title="USD/JPY_1" width="580" height="400">
USD/JPY traded sharply lower today, taking cue from the slide in Nikkei 225 that saw the index losing 7.32% in a single day. The decline in stocks was so huge that Economy Minister Amari had to come out and speak publicly on the happenings in order to ease tensions and answer questions. However, Amari failed to instil confidence back into the market, with USD/JPY continue to slide lower after he said at first that the stock decline was due to the worse than expected Chinese data, then change his tone and say that profit taking may be the smoking gun here. It is funny to see the Economy Minister had to tell reporters explicitly that there was “no need to be perturbed”. Alright then, nothing to see here, lets move along. Perhaps he himself is shock that such a strong decline could happen when “Abenomics” is still up and running, and is seeking for answers himself.
Today’s setback is the 2nd blow for Japan, and hints that the market may be getting out of BOJ and the Government’s control. Yesterday Kuroda said that yields should not be climbing higher anymore, only to see 10Y JGB pushing 1.00% during early trade. As the saying goes, when it rains it pours, and it is not surprising to see Japan starting to fail on all fronts – Currency, Bonds, Stocks – since there has been so much artificial manipulation in play since last year November. A correction of some kind was always on the books, and as Amari said it himself – speed of recent gains was faster than expected, and as such a pull back of larger magnitude may not be all too surprising.
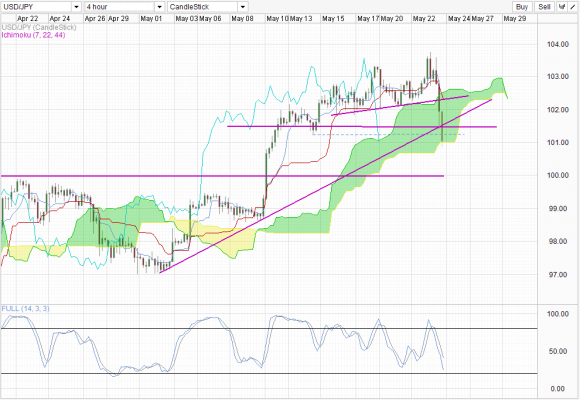
That being said, USD/JPY the wheels of the bull cart appears to have fallen off from a technical perspective. Price has broken away from the 102 and 101.5 support. The only support that is preventing a full bearish onslaught is the 101.0 line which happens to be the confluence with current Kumo’s Senkou Span B. If the level is broken, a move back towards 100.0 becomes possible and price may find better support from the consolidation range 97.0 – 100.0. Stochastic readings on the 4 Hourly Chart suggest that bears are not done yet, with readings still some distance away from the Oversold region. The stoch line appears to be just below the recent troughs back on 8th and 20th May, which can be interpreted as a stoch “bearish breakout” on its own.
Fundamentally, it is strange to see Yen strengthen due to stocks falling, even though the relationship has been noted in 2013 especially in the past 1-2 months. Generally stocks and currency strength should be positively correlated, but Yen can no longer be considered under the “general” category due to the strong intervention and market speculation surrounding it. This makes Yen’s directional motivation hard to grasp, and traders may instead want to look at USD for direction instead. With such a strong sell off in Nikkei, it is likely that the risk-off appetite will spillover to the US market. Already there are signs that today will be a bad day for US stocks with Futures already trading sharply lower. As such, we could see USD weakening and that will help USD/JPY move even lower today.