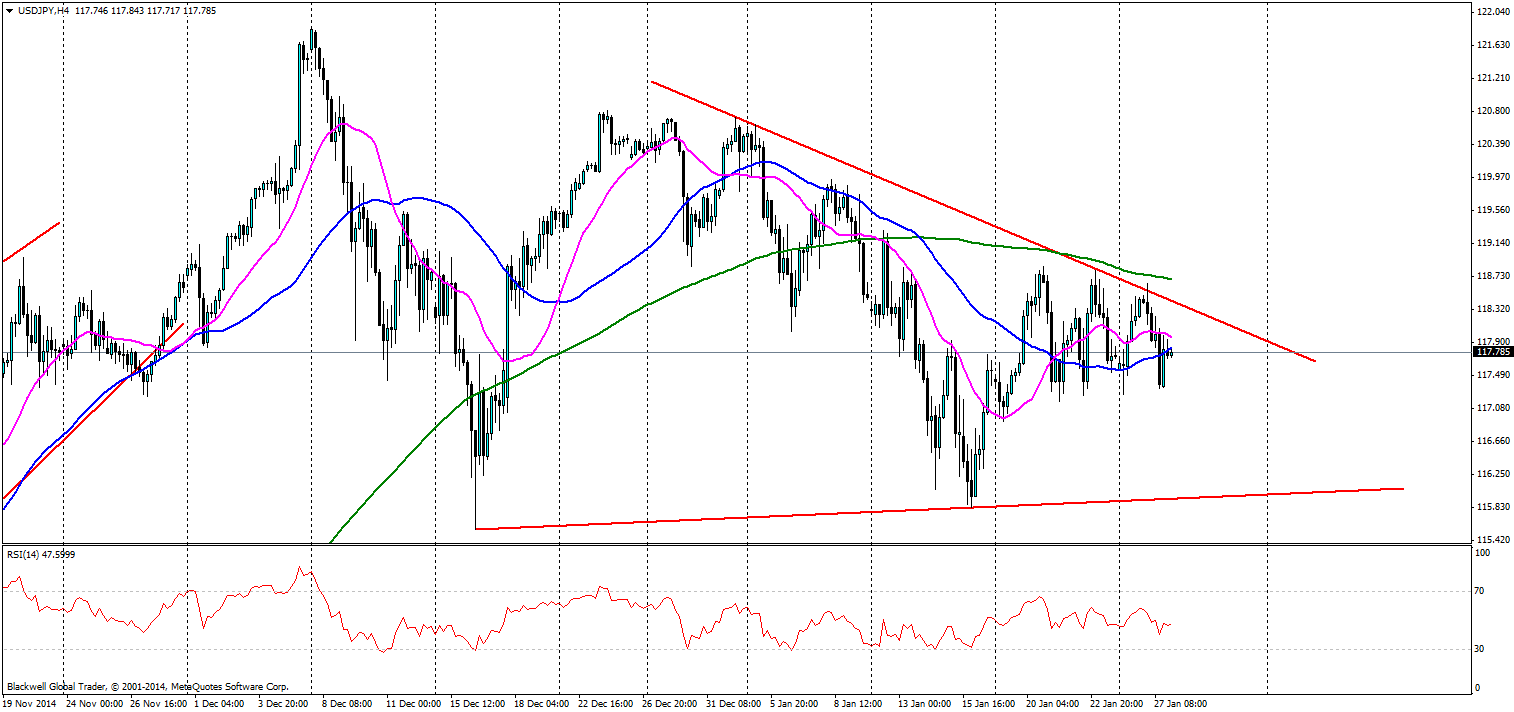
The USD/JPY has been trending slowly downwards on the charts for some time, and markets have been noticing these movements. Yesterdays failed test of the trend line lead to some hard selling for the USDJPY, especially as the CSPI y/y came in stronger than expected at 3.6% (3.5% forecast).

Source: Blackwell Trader (USD/JPY, H4)
The USD has been gaining ground in the short term, after the recent Euro-zone troubles. While many investors rushed into the Yen after the collapse of the SNB price floor it has since recovered, but has been met with a similar tight triangle pattern which we have seen numerous times over the past few years. These trend lines are normally market build up before a break out higher and in this case 120 is certainly an optimal target. The question going forward is when it will happen!
That question is hard to answer, but with good data from today we have seen the USD/JPY sink lower on the charts, and it’s likely that positive data for the Japanese economy would strengthen it further against the USD.
The Moving averages (MA) on the chart are not that strong for the USD/JPY pair. The 20 MA does not get that much respect for movements, while the 50 MA only just manages to get more respect from market movers. The 200 day MA tough could act as strong resistance in the event of a breakout.

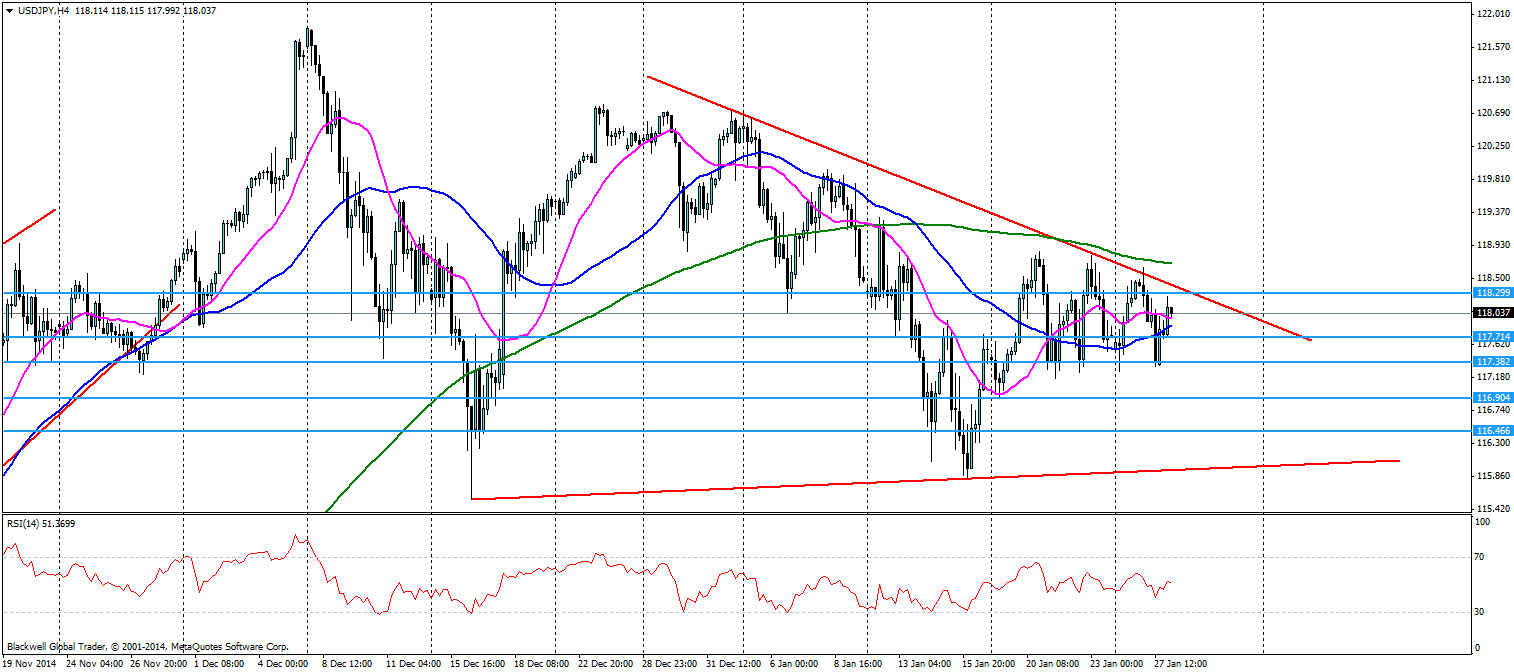
Source: Blackwell Trader (USD/JPY, H4)
Looking at the charts there are some key levels to be found at 117.714, 117.382 and 116.904 as the next possible levels as the USD/JPY falls lower. These levels should be watched closely as we have seen the USD/JPY range strongly along these levels and use them as strong support/resistance levels.
Overall, the USD/JPY is a very active pair at the moment and with a strong trend line we may see further lows, especially with global uncertainty making a dent in the USD/JPY as of late.
