
The USD/JPY on the daily chart has extended its decline of the past three weeks by breaking down below key support around the 95.00 area. Although the current downside correction has constituted the greatest percentage decline since the bullish trend began nine months ago, price has only fallen enough to hit the 38.2% Fibonacci retracement of the uptrend from its September 2012 low at 77.11 to its May high at 103.72.
Relatively Shallow Correction
Therefore, within the context of the overall trend, the current bearish correction can still be considered a relatively shallow one at the present time. Further downside price moves, however, could quickly change this situation. The next major support levels to the downside include 92.00 and as far down as 88.00. A strong bounce around the current level or one of the lower retracement levels, however, could see a recovery back up at least towards the 100.00 level.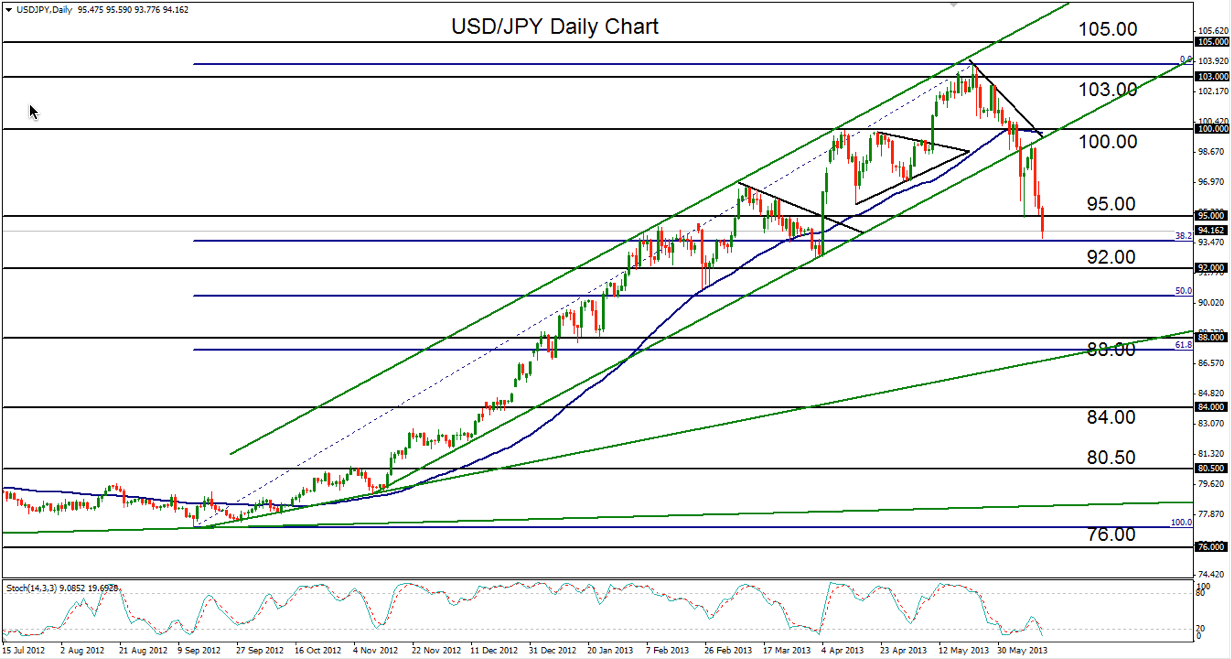 USD/JPY" width="1231" height="659">
- English (UK)
- English (India)
- English (Canada)
- English (Australia)
- English (South Africa)
- English (Philippines)
- English (Nigeria)
- Deutsch
- Español (España)
- Español (México)
- Français
- Italiano
- Nederlands
- Português (Portugal)
- Polski
- Português (Brasil)
- Русский
- Türkçe
- العربية
- Ελληνικά
- Svenska
- Suomi
- עברית
- 日本語
- 한국어
- 简体中文
- 繁體中文
- Bahasa Indonesia
- Bahasa Melayu
- ไทย
- Tiếng Việt
- हिंदी
USD/JPY Extends Decline: A Technical Look
Published 06/13/2013, 01:42 PM
Updated 07/09/2023, 06:31 AM
USD/JPY Extends Decline: A Technical Look
Latest comments
Loading next article…
Install Our App
Risk Disclosure: Trading in financial instruments and/or cryptocurrencies involves high risks including the risk of losing some, or all, of your investment amount, and may not be suitable for all investors. Prices of cryptocurrencies are extremely volatile and may be affected by external factors such as financial, regulatory or political events. Trading on margin increases the financial risks.
Before deciding to trade in financial instrument or cryptocurrencies you should be fully informed of the risks and costs associated with trading the financial markets, carefully consider your investment objectives, level of experience, and risk appetite, and seek professional advice where needed.
Fusion Media would like to remind you that the data contained in this website is not necessarily real-time nor accurate. The data and prices on the website are not necessarily provided by any market or exchange, but may be provided by market makers, and so prices may not be accurate and may differ from the actual price at any given market, meaning prices are indicative and not appropriate for trading purposes. Fusion Media and any provider of the data contained in this website will not accept liability for any loss or damage as a result of your trading, or your reliance on the information contained within this website.
It is prohibited to use, store, reproduce, display, modify, transmit or distribute the data contained in this website without the explicit prior written permission of Fusion Media and/or the data provider. All intellectual property rights are reserved by the providers and/or the exchange providing the data contained in this website.
Fusion Media may be compensated by the advertisers that appear on the website, based on your interaction with the advertisements or advertisers.
© 2007-2024 - Fusion Media Limited. All Rights Reserved.