The Japanese yen hit it’s highest levels against the US dollar in well over a year overnight. Something which obviously won’t be impressing the Bank of Japan and friend of Forex traders everywhere, Haruhiko Kuroda.
The man’s smile pose just works perfectly for the featured image on these articles, just look at the man. Oh wait, that’s not him!
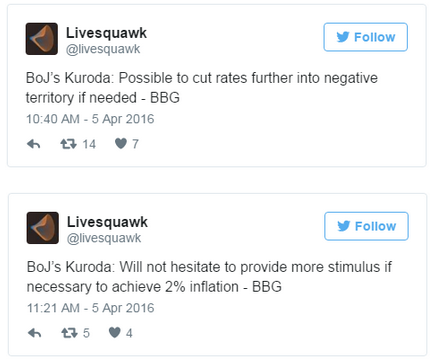
Back to business and the runaway strength of the yen. With the BoJ needing the weaker currency to boost stubbornly low inflation that just seems to be unmovable no matter what they do, this isn’t going down well. QE stimulus, even negative interest rates, just nothing is working for them and the constant comments that hit the newswires day after day have certainly lost their bang.

Yawn.
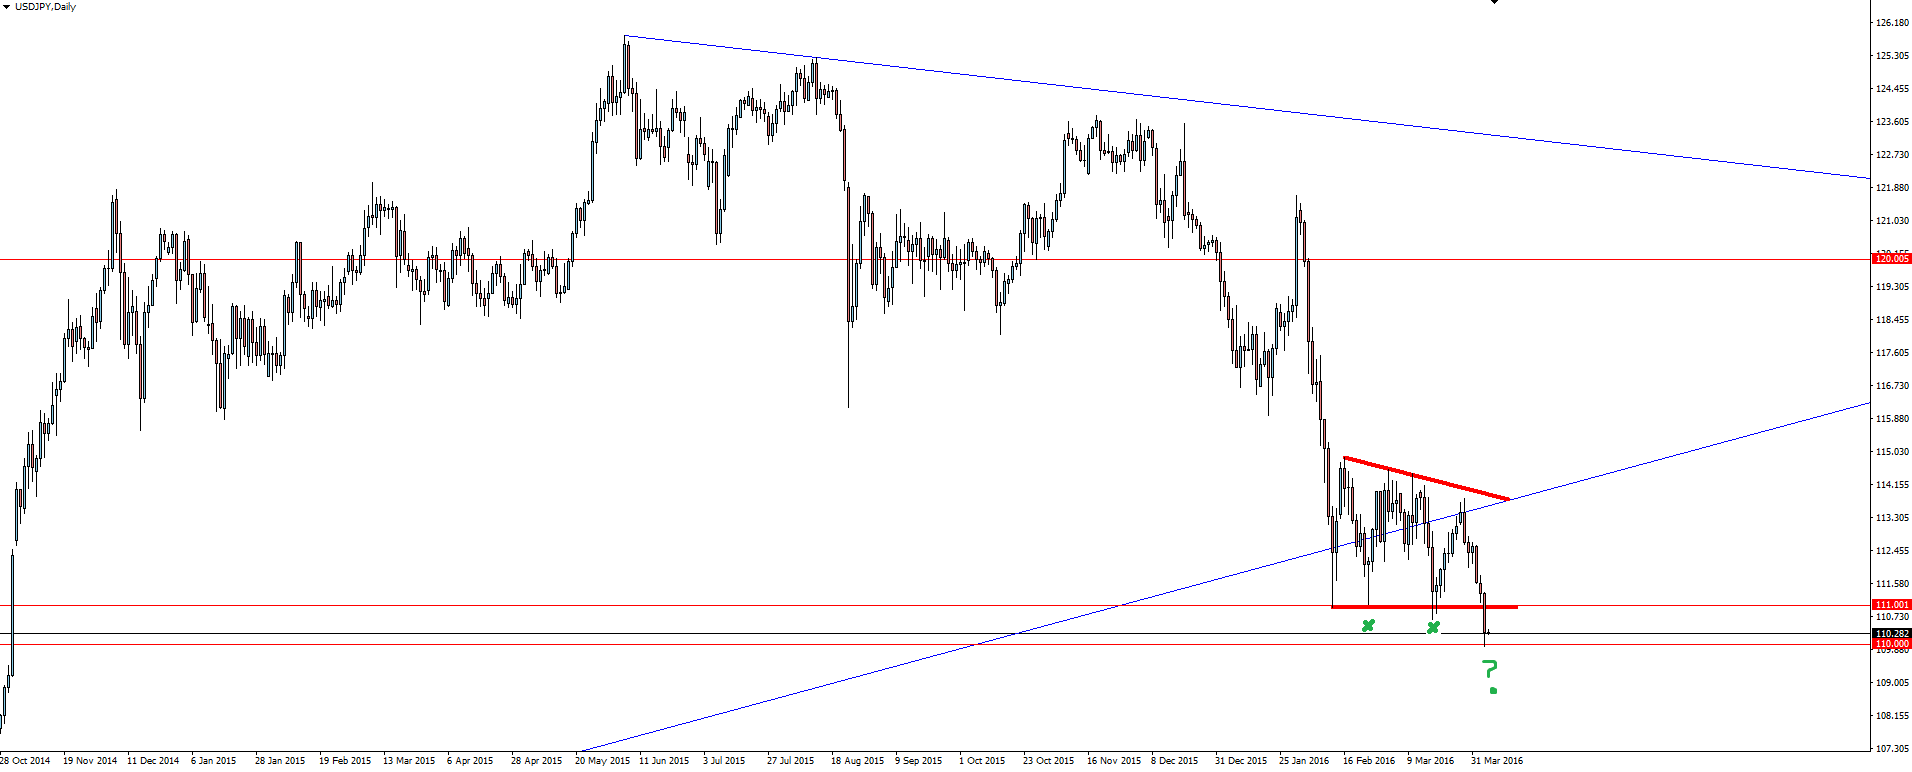
With risk-off the overriding theme throughout the day, the 110.000 level in USD/JPY was touched. The level is HUGELY significant because not only is it the psychological go-to level, but made even more significant by the fact that the BoJ was thought to have been testing the intervention waters at 111.000 as you can see from the spikes on the daily chart below.
Now price is 100 pips below that level… This is it.
USD/JPY Daily:
Does it even matter whether they intervene here? Price is simply going to get slapped back down again. So the question now becomes, has the BoJ learned you can’t fight the market.
Or can it…?
Chart of the Day:
Yesterday we featured AUD/JPY and once again it was the higher time frame resistance level that won out over short term support. I encourage you to go back over your charts and look at the amount of times you have the choice between trading a short term level against what the larger time frame charts are telling you, and to see what would have happened. Higher time frames are king!
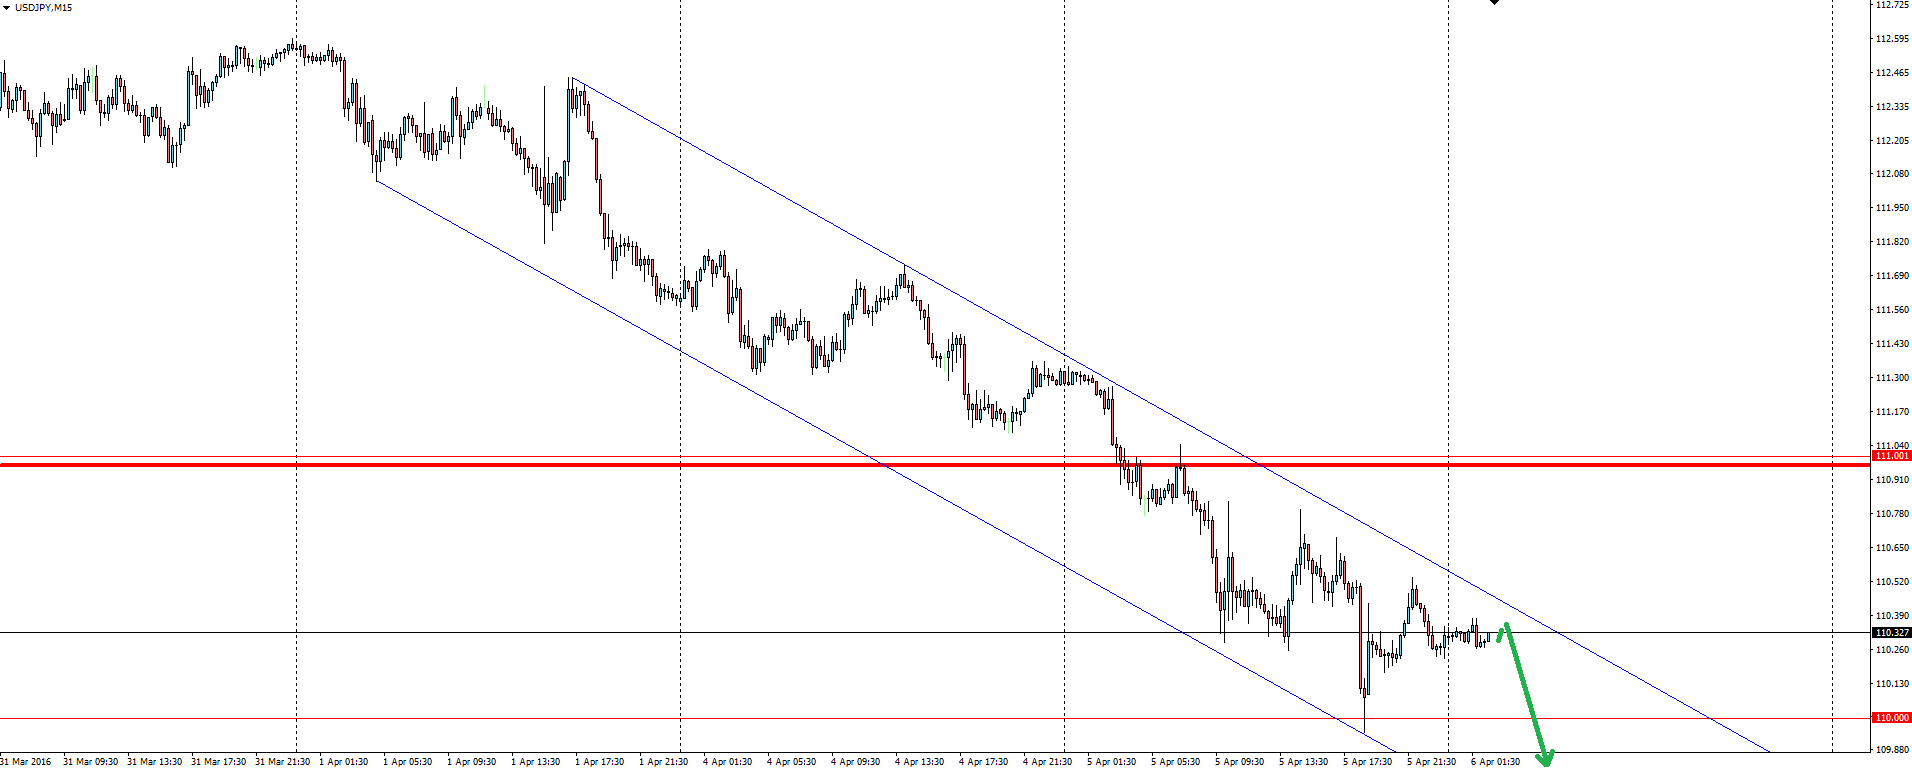
In today’s chart of the day, lets just look at how we can go about trading this Yen strength that we’ve spoken about throughout the blog.
Remember to be thinking within the context of the higher time frame charts above, but here’s the 15 minute chart. We have a bearish channel drawn in from the most obvious tops and see that price is now approaching resistance. Resistance that also happens to line up with previously broken support which could turn resistance.
The channel is going to be subjective because it’s on the 15 minute chart, but the bearish trend can’t be subjective and that’s what you’re looking to take advantage of here.
I know there is some market consensus that because price couldn’t hold below the 110.000 level, that it is now bullish. I don’t agree with that at all. As a USD/JPY bear, I really like the price action we are seeing now. To me, price testing the 110.000 and getting this bounce is a healthy move that means if the break comes, it will be much easier to sustain.
Now we wait. Intervention or a break of support?
On the Calendar Wednesday:
CNY Caixin Services PMI
AUD RBA Assist Gov Kent Speaks
USD Crude Oil Inventories
USD FOMC Meeting Minutes
Risk Disclosure: In addition to the website disclaimer below, the material on this page prepared by Vantage FX Pty Ltd does not contain a record of our prices or solicitation to trade. All opinions, news, research, prices or other information is provided as general news and marketing communication – not as investment advice. Consequently any person acting on it does so entirely at their own risk. The experts writers express their personal opinions and will not assume any responsibility whatsoever for the actions of the reader. We always aim for maximum accuracy and timeliness, and ASIC Forex Broker Vantage FX on the MT4 platform, shall not be liable for any loss or damage, consequential or otherwise, which may arise from the use or reliance on this service and its content, inaccurate information or typos. No representation is being made that any results discussed within the report will be achieved, and past performance is not indicative of future performance.

