
USD/JPY Open 84.42 High 85.87 Low 84.75 Close 85.43
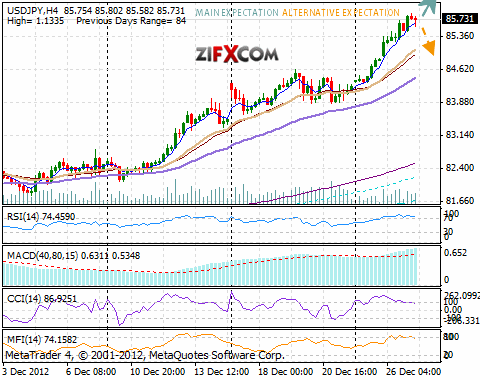
On Wednesday USD/JPY increased with almost 100 pips. The currency couple appreciated from 84.75 to 85.73 yesterday, matching the positive money flow sentiment at over +19%, closing the day at 85.43. This morning the dollar lifted slightly further against the yen, ascending to 85.87.
On the 1-hour chart the upward channel has resumed, while on the 3-hour chart the upward channel looks good. Break above today's top and nearest resistance 85.87 would encourage further recovery of the dollar. Immediate support is yesterday's bottom at 84.75, and consistent break below it could strengthen the yen further down towards next target 83.60.
Today are Japan Housing starts, Construction orders, Nationwide and Tokyo area CPI, Unemployment, Household spending, Retail sales, and Industrial output, at 5, 23:30 and 23:50 GMT respectively.
Quotes are moving above the 20 and 50 EMA on the 1-hour chart, indicating bullish pressure. The value of the RSI indicator is positive and calm, MACD is positive and tranquil too, while CCI has crossed up the 100 line on the 1-hour chart, giving over all light long signals.
Technical resistance levels: 85.87 86.75 87.57
Technical support levels: 84.75 83.60 82.42
 USD/JPY Chart" title="USD/JPY Chart" />
On Wednesday USD/JPY increased with almost 100 pips. The currency couple appreciated from 84.75 to 85.73 yesterday, matching the positive money flow sentiment at over +19%, closing the day at 85.43. This morning the dollar lifted slightly further against the yen, ascending to 85.87.
On the 1-hour chart the upward channel has resumed, while on the 3-hour chart the upward channel looks good. Break above today's top and nearest resistance 85.87 would encourage further recovery of the dollar. Immediate support is yesterday's bottom at 84.75, and consistent break below it could strengthen the yen further down towards next target 83.60.
Today are Japan Housing starts, Construction orders, Nationwide and Tokyo area CPI, Unemployment, Household spending, Retail sales, and Industrial output, at 5, 23:30 and 23:50 GMT respectively.
Quotes are moving above the 20 and 50 EMA on the 1-hour chart, indicating bullish pressure. The value of the RSI indicator is positive and calm, MACD is positive and tranquil too, while CCI has crossed up the 100 line on the 1-hour chart, giving over all light long signals.
Technical resistance levels: 85.87 86.75 87.57
Technical support levels: 84.75 83.60 82.42
USD/JPY Chart" title="USD/JPY Chart" />