Hourly Chart USD/INR Hourly" title="USD/INR Hourly" height="631" width="990">
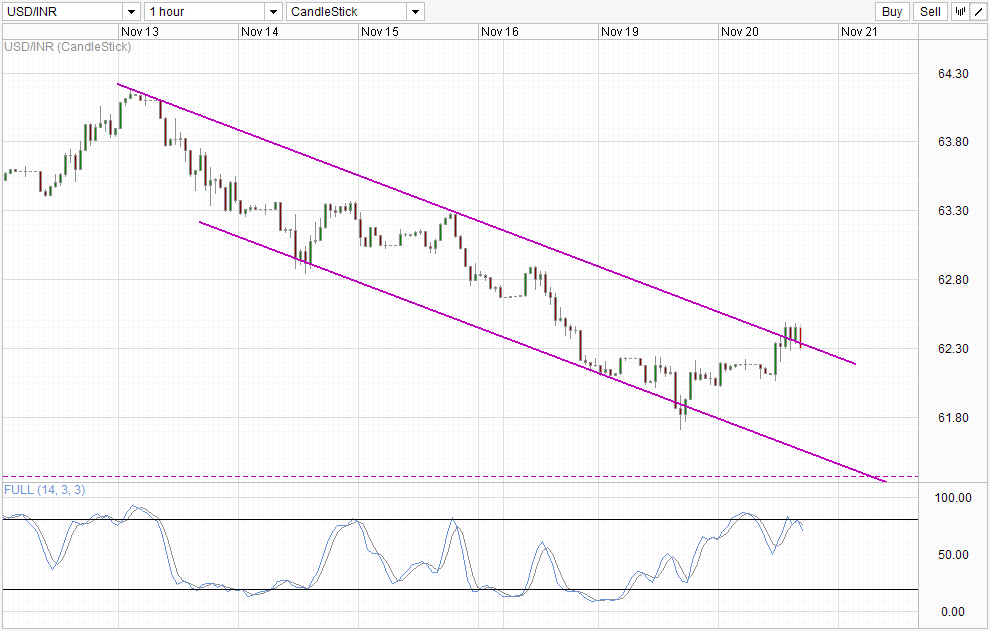
Bearish trend in USD/INR continues despite the rally seen during European session yesterday. Prices remain capped below by Channel Top, with Stochastic indicator showing a bearish cycle signal. Channel Bottom becomes an obvious bearish objective, and there may strong bearish acceleration should price breach 62.2 in conjunction with stochastic pushing below 60.0.
Should prices push above 62.45, further bullish pressure cannot be ignored, with 62.8 becoming the immediate bullish objective. However, the overall bearish bias is still not invalidated, which increases the likelihood of a pullback towards Channel Top once again. Price should preferably push above 63.3 before bearish pressure can be eased.
It is also important to note that USD/INR has been decreasing in the past few days due to weakness in USD. Should USD strength come back into play, this short-term bearish bias will need to be re-evaluated. As it is right now there are early signs that USD strength may be coming back. Yesterday's dovish speeches by Bernanke, Yellen and Evans failed to impress market, with Stocks, Gold and Bond prices falling. This suggest that speculators that have been betting on a non-taper outcome in December FOMC may be fully saturated, and we could see long-term fundamental drivers playing a larger influence moving forward.
Weekly Chart USD/INR_Weekly" title="USD/INR_Weekly" height="631" width="990">
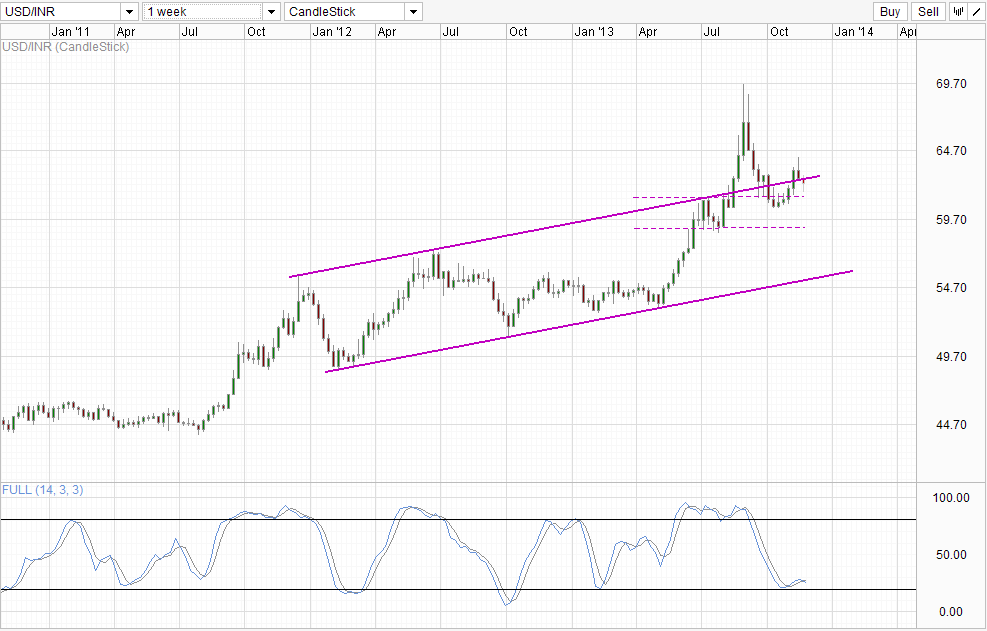
This would mean that prices may be on-track to move back towards 70.0. Currently prices are trading below Channel Top, but we are still some distance away from a bearish confirmation. Hence the likelihood of a false break is high. Similarly, Stochastic readings are pointing lower and crossing the Signal line, but we are situated very close to the Oversold region with the previous bullish signal barely taking off. Without pushing below the recent trough above 20.0, the bullish cycle can technically remain in play, once again increasing the odds of a false break.
It is not all doom and gloom for Rupee though, International Finance Corp - the financing arm of the World Bank, issued Rupee denominated bonds for the first time as part of the USD $1B rupee-linked program. The first tranche of issuance is for 3Y Bonds priced at 7.75%, which is close to Indian Government Bonds of similar maturity (7.59% for 3Y and 8.07% for 4Y). The demand was much higher than expected, with investors wanting as much as INR 20 billion versus IFC's expected issuance size of between 3 - 10 billion INR. The high demand for INR linked products is a good sign that foreign investors have not given up on INR yet and implies that investors do not think that INR will not be depreciating too much in the next few years.
Hence, even if USD/INR is slated to rally from here out, do not expect the same sort of bullish momentum back in May, and expect much more resistance along the way.
Original post
- English (UK)
- English (India)
- English (Canada)
- English (Australia)
- English (South Africa)
- English (Philippines)
- English (Nigeria)
- Deutsch
- Español (España)
- Español (México)
- Français
- Italiano
- Nederlands
- Português (Portugal)
- Polski
- Português (Brasil)
- Русский
- Türkçe
- العربية
- Ελληνικά
- Svenska
- Suomi
- עברית
- 日本語
- 한국어
- 简体中文
- 繁體中文
- Bahasa Indonesia
- Bahasa Melayu
- ไทย
- Tiếng Việt
- हिंदी
USD/INR: S/T Bearish Trend Intact, Long-Term Outlook Mixed
Published 11/20/2013, 05:19 AM
Updated 07/09/2023, 06:31 AM
USD/INR: S/T Bearish Trend Intact, Long-Term Outlook Mixed
Latest comments
Loading next article…
Install Our App
Risk Disclosure: Trading in financial instruments and/or cryptocurrencies involves high risks including the risk of losing some, or all, of your investment amount, and may not be suitable for all investors. Prices of cryptocurrencies are extremely volatile and may be affected by external factors such as financial, regulatory or political events. Trading on margin increases the financial risks.
Before deciding to trade in financial instrument or cryptocurrencies you should be fully informed of the risks and costs associated with trading the financial markets, carefully consider your investment objectives, level of experience, and risk appetite, and seek professional advice where needed.
Fusion Media would like to remind you that the data contained in this website is not necessarily real-time nor accurate. The data and prices on the website are not necessarily provided by any market or exchange, but may be provided by market makers, and so prices may not be accurate and may differ from the actual price at any given market, meaning prices are indicative and not appropriate for trading purposes. Fusion Media and any provider of the data contained in this website will not accept liability for any loss or damage as a result of your trading, or your reliance on the information contained within this website.
It is prohibited to use, store, reproduce, display, modify, transmit or distribute the data contained in this website without the explicit prior written permission of Fusion Media and/or the data provider. All intellectual property rights are reserved by the providers and/or the exchange providing the data contained in this website.
Fusion Media may be compensated by the advertisers that appear on the website, based on your interaction with the advertisements or advertisers.
© 2007-2025 - Fusion Media Limited. All Rights Reserved.