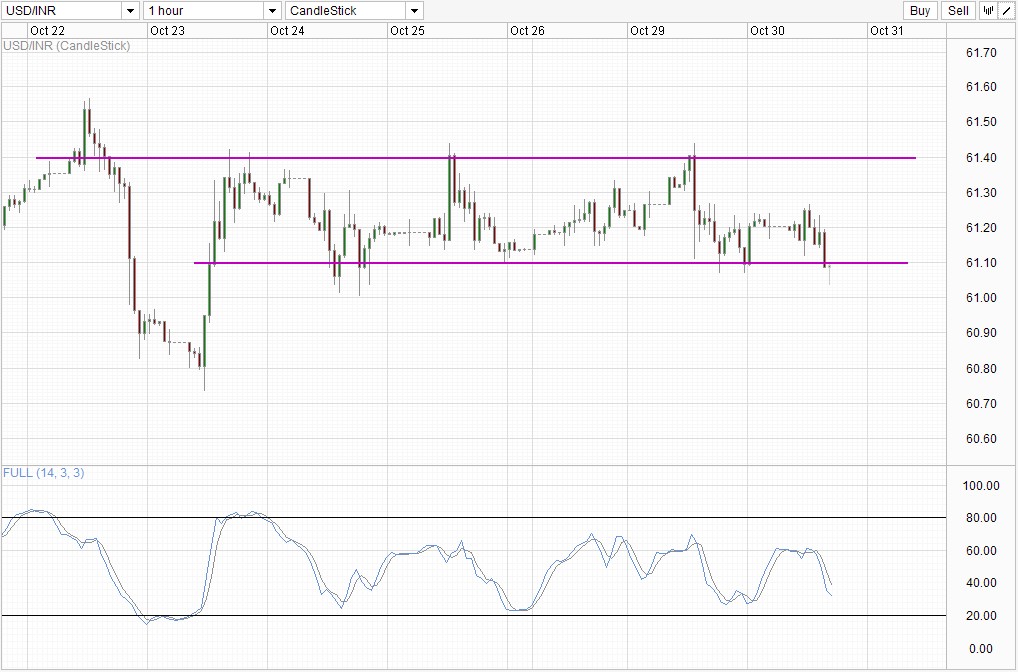
Despite raising the policy interest rate for the second time in 2 months, USD/INR remains stubbornly supported. Since 23rd October, USD/INR has been stuck mostly within 61.1 - 61.4 range, and the latest rate hike only served to confirm the 61.40 ceiling, sending price to the 61.1 floor instead of breaking out of the consolidation range.
Perhaps market is less than convinced with the mixed approach in RBI's latest bout of policy changes, which includes a hike in the reverse repo rate to 6.75% and a cut of the Marginal Standing Facility (MSF) rate by 25 bps to 8.75%. This is most likely a necessity by Governor Rajan as RBI is concurrently combating a declining economic growth and runaway inflation. However, in so doing, RBI run the risk of failing on both ends as there is incongruency between raising rate on one and decreasing the other. Clearly the market is not buying that the latest rate hikes on repo and reverse repo rates will appreciate the Rupee, especially since last month's repo rate hike without MSF cut did not achieve much traction for Rupee bulls. Furthermore, it remains to be seen whether the cut in MSF will help to offset the bearish impact on economic growth, and Rajan may end up worsening the economy with Rupee none the better - which is a long term bearish risk for Rupee (bullish for USD/INR) as a continued weakening Indian economy will encourage more outflow of foreign investments and hence a weaker Rupee in the future.
Hourly Chart
Nonetheless, short-term outlook for USD/INR remains slightly bearish for now. Firstly, it should be noted that USD has actually appreciated 1.51% against a basket of the 6 other major currencies since 23rd October. The fact that USD/INR stayed flat instead of higher is a good sign that bearish pressure remains strong.
Currently, prices are trading slightly below the 61.1 support which opens up the likelihood of a proper bearish breakout. However, prices should ideally push below 61.0 as we have seen similar activity back on 24th October where the venture below 61.1 only ended in a false breakout. Furthermore, Stochastic is approaching the previous trough of around 30.0, and we could see stoch curve rebounding from here similarly as well.
Weekly Chart USD/INR_2" border="0" height="672" width="1018">
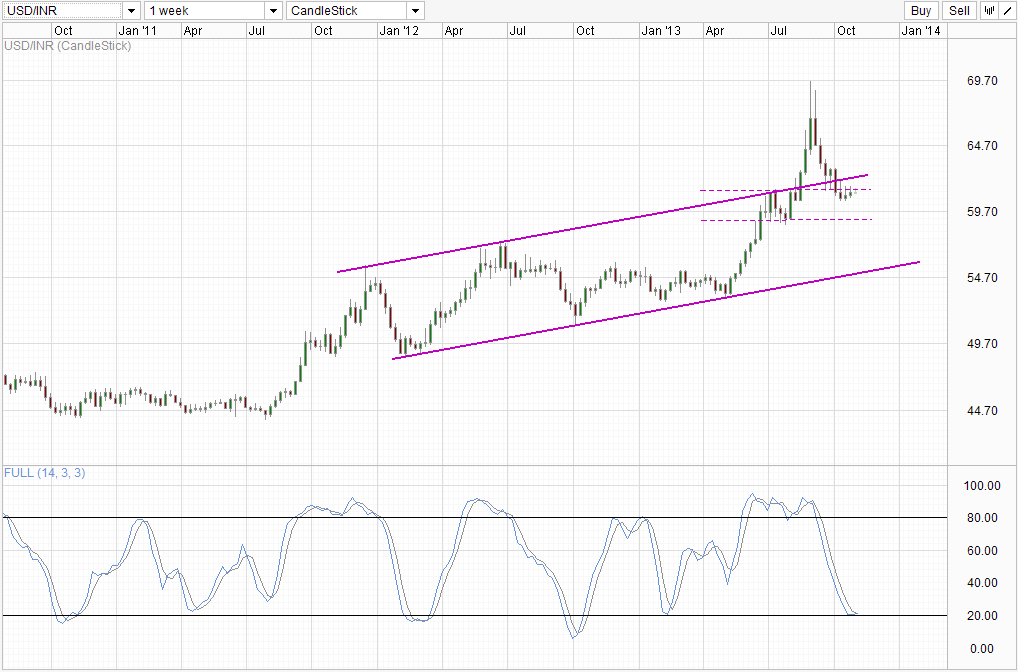
Long-term technicals favor bearish movements, with 61.4 showing even greater importance here as it opens up the possibility of 59.0 as a bearish target. That being said, Stochastic readings suggest that current bullish pullback may grow stronger with stoch readings flattening and potentially giving us a weak bull cycle signal. This implies that we could see a break of 61.4 and opens up the possibility of a retest of Channel Top should that happens.
FOMC rate decision today (Thursday 2:00 am SGT), we could have yet another confirmation to tell us the direction market is favoring right now. Should FOMC statement is more dovish than expected yet USD/INR remains supported above 61.10, the likelihood of price pushing back towards 61.4 increases. Conversely, if FOMC turned out to be more hawkish and USD/INR stays below 61.1 and preferably below 61.0, this could provide the initial impetus for stronger bearish movement in USD/INR.
Original post
- English (UK)
- English (India)
- English (Canada)
- English (Australia)
- English (South Africa)
- English (Philippines)
- English (Nigeria)
- Deutsch
- Español (España)
- Español (México)
- Français
- Italiano
- Nederlands
- Português (Portugal)
- Polski
- Português (Brasil)
- Русский
- Türkçe
- العربية
- Ελληνικά
- Svenska
- Suomi
- עברית
- 日本語
- 한국어
- 简体中文
- 繁體中文
- Bahasa Indonesia
- Bahasa Melayu
- ไทย
- Tiếng Việt
- हिंदी
USD/INR: Flat Between 61.1 – 61.4 Despite RBI Rate Hike
Published 10/30/2013, 06:21 AM
USD/INR: Flat Between 61.1 – 61.4 Despite RBI Rate Hike
Latest comments
Loading next article…
Install Our App
Risk Disclosure: Trading in financial instruments and/or cryptocurrencies involves high risks including the risk of losing some, or all, of your investment amount, and may not be suitable for all investors. Prices of cryptocurrencies are extremely volatile and may be affected by external factors such as financial, regulatory or political events. Trading on margin increases the financial risks.
Before deciding to trade in financial instrument or cryptocurrencies you should be fully informed of the risks and costs associated with trading the financial markets, carefully consider your investment objectives, level of experience, and risk appetite, and seek professional advice where needed.
Fusion Media would like to remind you that the data contained in this website is not necessarily real-time nor accurate. The data and prices on the website are not necessarily provided by any market or exchange, but may be provided by market makers, and so prices may not be accurate and may differ from the actual price at any given market, meaning prices are indicative and not appropriate for trading purposes. Fusion Media and any provider of the data contained in this website will not accept liability for any loss or damage as a result of your trading, or your reliance on the information contained within this website.
It is prohibited to use, store, reproduce, display, modify, transmit or distribute the data contained in this website without the explicit prior written permission of Fusion Media and/or the data provider. All intellectual property rights are reserved by the providers and/or the exchange providing the data contained in this website.
Fusion Media may be compensated by the advertisers that appear on the website, based on your interaction with the advertisements or advertisers.
© 2007-2025 - Fusion Media Limited. All Rights Reserved.