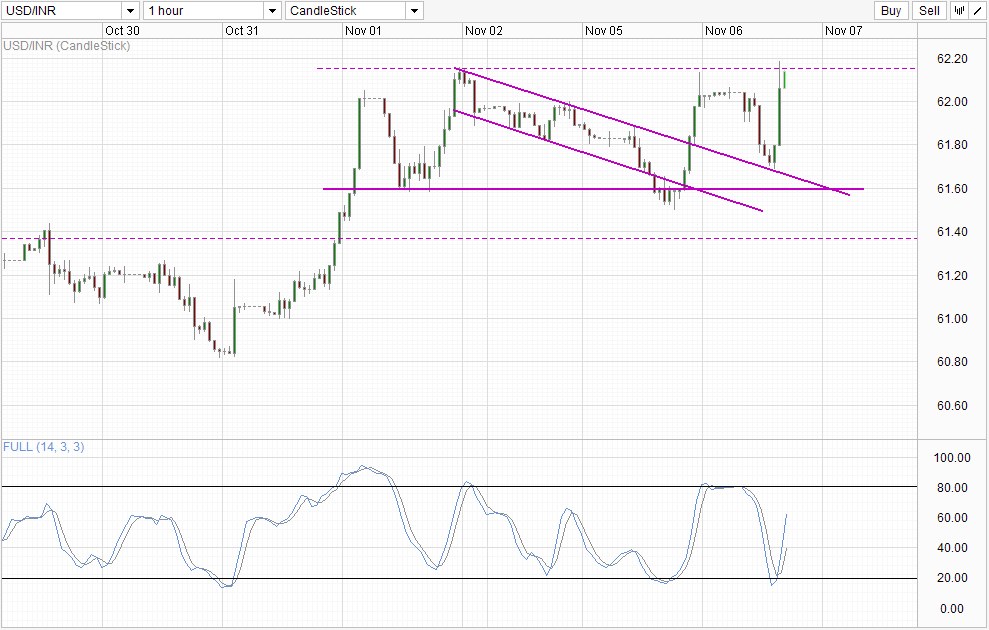
Indian Rupee did not move as expected yesterday, with prices recovering quickly above 61.6 instead of pushing towards the support level of 61.35. With USD trading flat during the same period, the reason for yesterday's recovery appears to be based on weakness in INR. However, there wasn't any fundamental news release during the period that could have shifted sentiment, and the only reasonable explanation would be bullish INR traders realizing that they have overextended themselves by shorting USD/INR following the PMI numbers when stocks prices and risk appetite do not support such a bullish reaction.
This would mean that the subsequent rally can be interpreted as a one-time revaluation and does not necessary mean that overall sentiment of USD/INR. This could also explain why USD/INR dipped lower once again during today's Asian session even though fundamentals news are sorely lacking again.
Technicals play an important part as well. It is likely that swing traders shorted USD/INR above the 62.0 ceiling, adding further bearish pressure on top of the original mild bearish bias that was seen on Monday. This assertion is strengthened when it is observed that prices found support from the original Descending Channel that was in play from the decline of last Friday. The resulting bullish response is huge, but we're once again facing resistance once again in the form of last Friday's swing high.
Hourly Chart: USD/INR " title="USD/INR " height="630" width="989">
Considering that this move is purely technical, it is hard to imagine prices gaining much traction above 62.2. Nonetheless, Stochastic readings remain optimistic for now, with current readings level suggest that prices may even reach as high as 62.4~ using previous bullish cycle as reference. However, there is every chance that Stochastic readings will be able to reverse from here, as there are precedence with numerous inflexion points around current levels within the past 5 trading days, which opens up 61.6 as a bearish target.
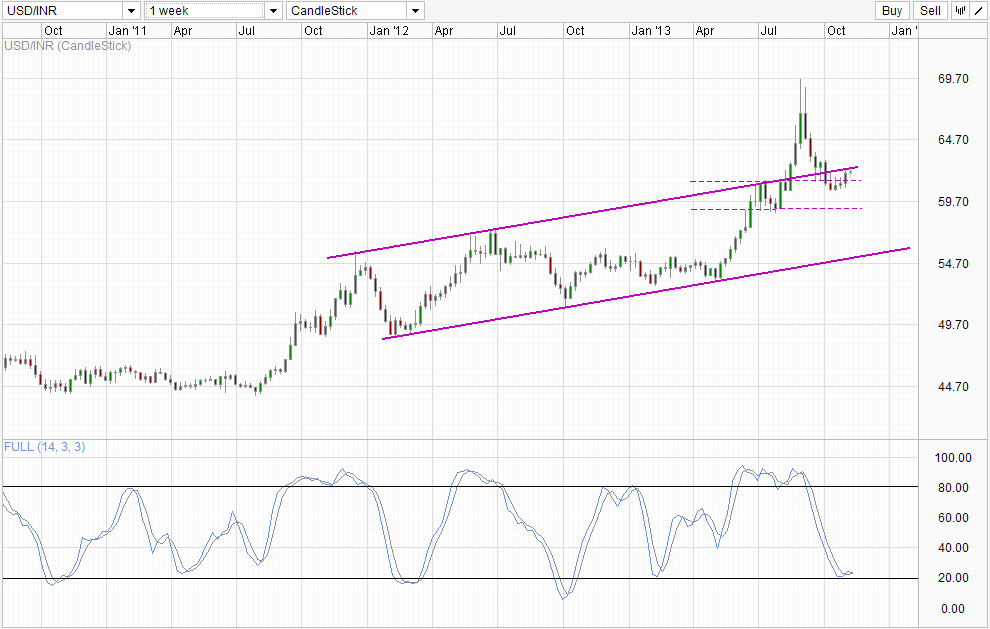
Weekly Chart USD/INR " title="USD/INR " height="630" width="989">
Weekly Chart agrees with an eventual bearish pullback as well, as prices are currently testing Channel Top right now. Interestingly, Channel Top is currently around 62.4 as well, adding credence to the analysis above that short-term bullish momentum may run out of steam around there. This increases the strength of the Channel Top resistance, and opens up a move to 61.35 once again.
Original post
- English (UK)
- English (India)
- English (Canada)
- English (Australia)
- English (South Africa)
- English (Philippines)
- English (Nigeria)
- Deutsch
- Español (España)
- Español (México)
- Français
- Italiano
- Nederlands
- Português (Portugal)
- Polski
- Português (Brasil)
- Русский
- Türkçe
- العربية
- Ελληνικά
- Svenska
- Suomi
- עברית
- 日本語
- 한국어
- 简体中文
- 繁體中文
- Bahasa Indonesia
- Bahasa Melayu
- ไทย
- Tiếng Việt
- हिंदी
USD/INR: Bullish But 62.4 Resistance Hangs Overhead
Published 11/06/2013, 05:09 AM
Updated 07/09/2023, 06:31 AM
USD/INR: Bullish But 62.4 Resistance Hangs Overhead
Latest comments
Loading next article…
Install Our App
Risk Disclosure: Trading in financial instruments and/or cryptocurrencies involves high risks including the risk of losing some, or all, of your investment amount, and may not be suitable for all investors. Prices of cryptocurrencies are extremely volatile and may be affected by external factors such as financial, regulatory or political events. Trading on margin increases the financial risks.
Before deciding to trade in financial instrument or cryptocurrencies you should be fully informed of the risks and costs associated with trading the financial markets, carefully consider your investment objectives, level of experience, and risk appetite, and seek professional advice where needed.
Fusion Media would like to remind you that the data contained in this website is not necessarily real-time nor accurate. The data and prices on the website are not necessarily provided by any market or exchange, but may be provided by market makers, and so prices may not be accurate and may differ from the actual price at any given market, meaning prices are indicative and not appropriate for trading purposes. Fusion Media and any provider of the data contained in this website will not accept liability for any loss or damage as a result of your trading, or your reliance on the information contained within this website.
It is prohibited to use, store, reproduce, display, modify, transmit or distribute the data contained in this website without the explicit prior written permission of Fusion Media and/or the data provider. All intellectual property rights are reserved by the providers and/or the exchange providing the data contained in this website.
Fusion Media may be compensated by the advertisers that appear on the website, based on your interaction with the advertisements or advertisers.
© 2007-2025 - Fusion Media Limited. All Rights Reserved.