Hourly Chart USD/INR Chart" title="USD/INR Chart" height="629" width="989">
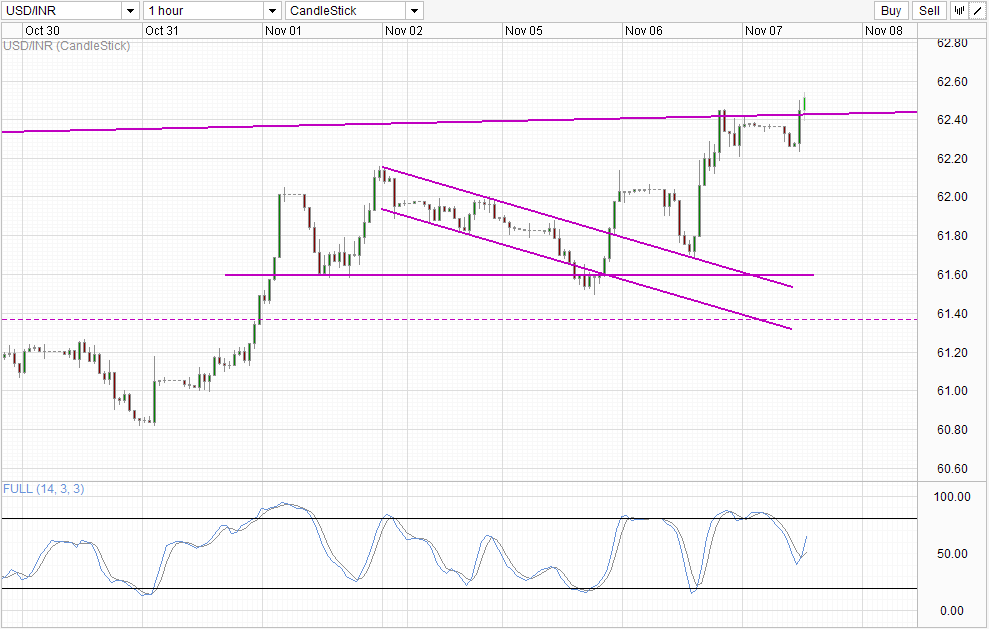
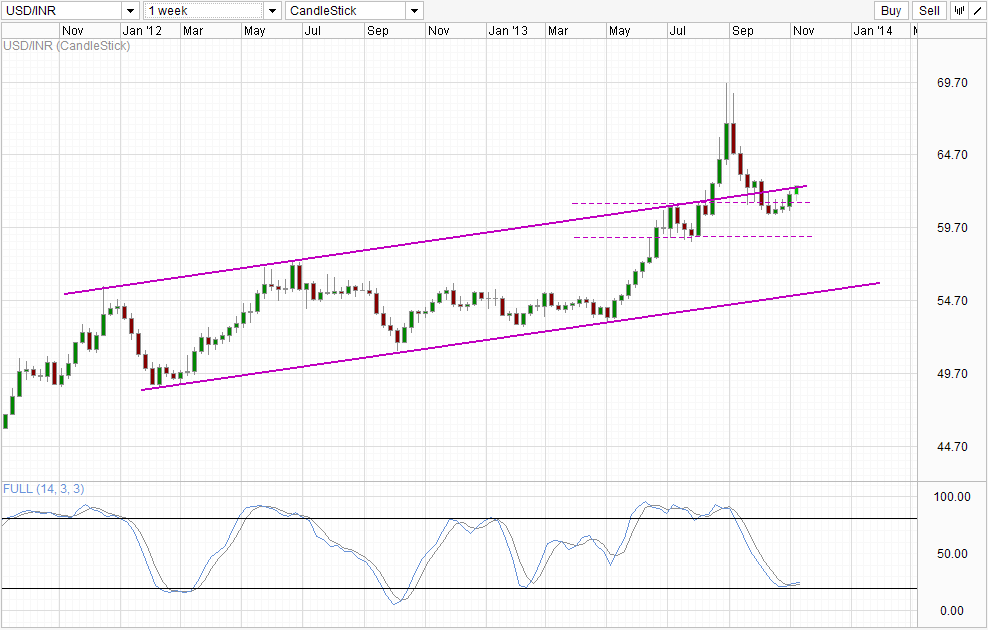
USD/INR tagged the 62.4 level yesterday as expected, but the subsequent bearish push was much weaker than expected. the soft support of 62.2 held firm, with prices subsequently rebounding higher and breaking the Channel Top resistance (see Weekly Chart below), suggesting that a bullish breakout is in play currently.
On hindsight, there are signs of a strong bullish push in the making - the initial bearish reaction after the rising trendline has been tagged was mostly muted which averted a bearish cycle signal from the Stochastic indicator. The bearish cycle signal did appear subsequently, but currently momentum has swung in favor of the bulls, with Stoch readings making a sharp turn pointing higher. The fact that Stoch curve has pushed above the 60.0 level (where previous Stoch peaks were seen) is a good sign that conviction is strong. This increases the likelihood of a sustained bullish push above the rising trendline in the S/T and, with 62.6 an estimated bullish target based on the space afforded before Stoch curve enters Overbought regions.
Weekly Chart USD/INR Chart" title="USD/INR Chart" height="629" width="989">
From a long-term perspective, the prospect of a Channel Top break is a welcomed return to the long-term trend. Stochastic indicator is also in favor of a bullish cycle move with stoch curve finally distancing itself away from the Signal line and affirming the Stoch trough that was formed 2 weeks ago. Furthermore, fundamentals continue to favor a bullish USD/INR. For all the misgivings about the political kerfuffle surrounding the debt ceiling issue and the potential bearish impact of QE tapering, US economy is undoubtedly in a much healthier state than India. At the very least it is moving in the direction of recovery. A potential QE tapering scenario will further strengthen USD as well, favoring a bullish push in USD/INR.
Therefore, with short-term technicals pointing higher and getting in line with bullish long-term technicals coupling with bullish fundamentals, a potential push all the way towards 70.0 is in the cards. Watch out for acceleration towards the upside when the breakout is confirmed on both the short and long term charts.
Original post
- English (UK)
- English (India)
- English (Canada)
- English (Australia)
- English (South Africa)
- English (Philippines)
- English (Nigeria)
- Deutsch
- Español (España)
- Español (México)
- Français
- Italiano
- Nederlands
- Português (Portugal)
- Polski
- Português (Brasil)
- Русский
- Türkçe
- العربية
- Ελληνικά
- Svenska
- Suomi
- עברית
- 日本語
- 한국어
- 简体中文
- 繁體中文
- Bahasa Indonesia
- Bahasa Melayu
- ไทย
- Tiếng Việt
- हिंदी
USD/INR: Bullish Breakout On Short And Long Term Charts
Published 11/07/2013, 03:49 AM
Updated 07/09/2023, 06:31 AM
USD/INR: Bullish Breakout On Short And Long Term Charts
Latest comments
Loading next article…
Install Our App
Risk Disclosure: Trading in financial instruments and/or cryptocurrencies involves high risks including the risk of losing some, or all, of your investment amount, and may not be suitable for all investors. Prices of cryptocurrencies are extremely volatile and may be affected by external factors such as financial, regulatory or political events. Trading on margin increases the financial risks.
Before deciding to trade in financial instrument or cryptocurrencies you should be fully informed of the risks and costs associated with trading the financial markets, carefully consider your investment objectives, level of experience, and risk appetite, and seek professional advice where needed.
Fusion Media would like to remind you that the data contained in this website is not necessarily real-time nor accurate. The data and prices on the website are not necessarily provided by any market or exchange, but may be provided by market makers, and so prices may not be accurate and may differ from the actual price at any given market, meaning prices are indicative and not appropriate for trading purposes. Fusion Media and any provider of the data contained in this website will not accept liability for any loss or damage as a result of your trading, or your reliance on the information contained within this website.
It is prohibited to use, store, reproduce, display, modify, transmit or distribute the data contained in this website without the explicit prior written permission of Fusion Media and/or the data provider. All intellectual property rights are reserved by the providers and/or the exchange providing the data contained in this website.
Fusion Media may be compensated by the advertisers that appear on the website, based on your interaction with the advertisements or advertisers.
© 2007-2025 - Fusion Media Limited. All Rights Reserved.