Hourly Chart USD/INR Hourly" title="USD/INR Hourly" height="566" width="895">
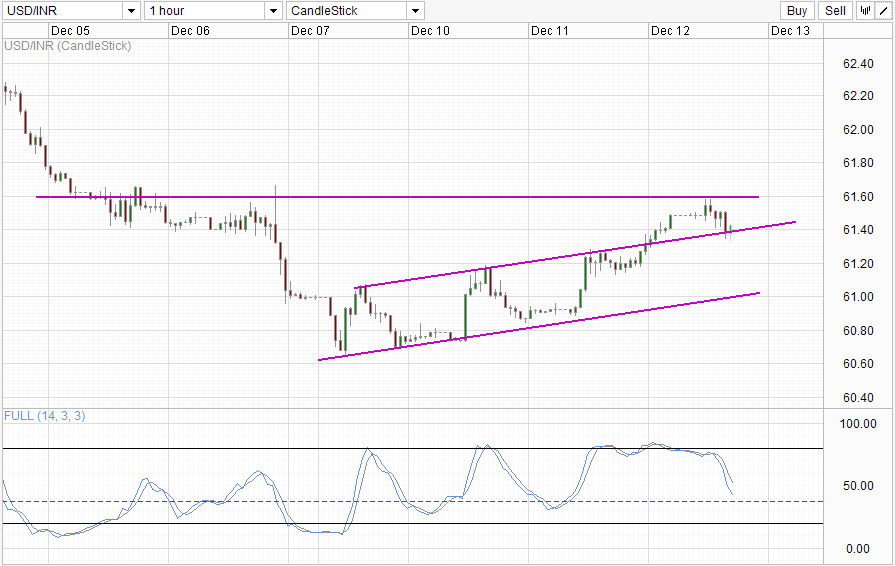
Has the rupee turned the corner? USD/INR has been rising continuously ever since the weekly low was forged on Monday, with sharp rallies seen around 11am SGT (10pm EST) for the past 3 days. Prices did rally similarly today at 11 am SGT but the magnitude is much lower than before, with the rally capped by the 61.6 ceiling which was the topside of the consolidation zone seen on the 5th and 6th December. Currently, price has found support via the rising Channel Top around 61.4 which also happens to be the confluence for the aforementioned consolidation zone's floor.
Stochastic readings suggest that prices may be able to break into the rising Channel, but a direct move towards the Channel Bottom is less likely considering that the Stoch curve is below 50.0 and most likely will be within the Oversold region when price hits yesterday's consolidation region, between 61.15 - 61.25. Nonetheless, as long as the price stays below the Channel Top, the Channel Bottom will remain a viable target moving forward.
Daily Chart USD/INR Daily" title="USD/INR Daily" height="566" width="895">
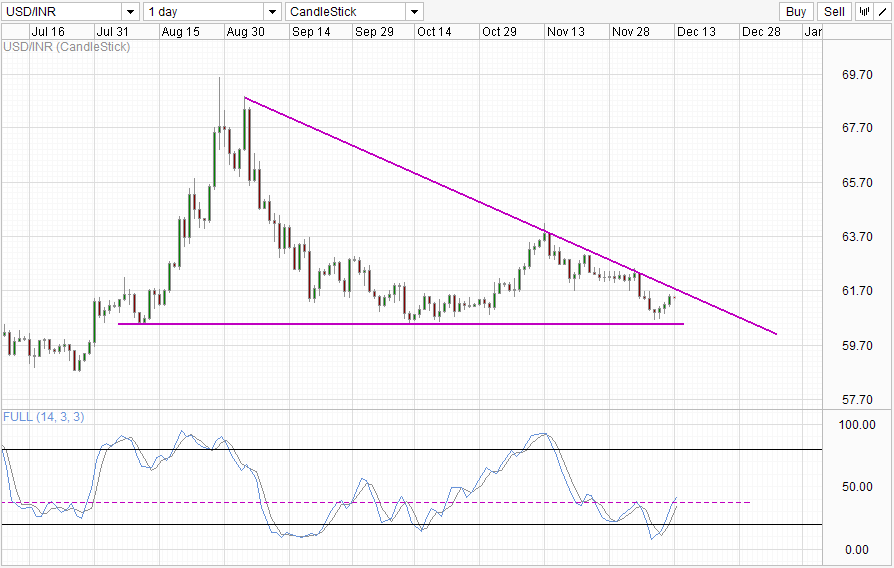
The Daily Chart also favors bearish movements with the descending trendline providing overhead resistance. A bullish cycle is in play currently, but the Stoch curve may still reverse around the "resistance" level, around 36.8. Should the descending trendline hold, the bearish target would be the 60.5 support which kept prices afloat back in early October and early August.
It should be noted that recent declines in the USD/INR were contributed to by the fall in Indian stock prices, with the Sensex heading lower since Monday - the start of current USD/INR rally. Hence, in order for continued bearish movement in USD/INR, we should see the Sensex reversing its current decline, without which it would be hard for a long-term sustained strengthening of the INR, especially given that economic fundamentals in India continue to remain weak.
Original post
- English (UK)
- English (India)
- English (Canada)
- English (Australia)
- English (South Africa)
- English (Philippines)
- English (Nigeria)
- Deutsch
- Español (España)
- Español (México)
- Français
- Italiano
- Nederlands
- Português (Portugal)
- Polski
- Português (Brasil)
- Русский
- Türkçe
- العربية
- Ελληνικά
- Svenska
- Suomi
- עברית
- 日本語
- 한국어
- 简体中文
- 繁體中文
- Bahasa Indonesia
- Bahasa Melayu
- ไทย
- Tiếng Việt
- हिंदी
USD/INR: Bears Resisting Rupee’s Decline
Latest comments
Loading next article…
Install Our App
Risk Disclosure: Trading in financial instruments and/or cryptocurrencies involves high risks including the risk of losing some, or all, of your investment amount, and may not be suitable for all investors. Prices of cryptocurrencies are extremely volatile and may be affected by external factors such as financial, regulatory or political events. Trading on margin increases the financial risks.
Before deciding to trade in financial instrument or cryptocurrencies you should be fully informed of the risks and costs associated with trading the financial markets, carefully consider your investment objectives, level of experience, and risk appetite, and seek professional advice where needed.
Fusion Media would like to remind you that the data contained in this website is not necessarily real-time nor accurate. The data and prices on the website are not necessarily provided by any market or exchange, but may be provided by market makers, and so prices may not be accurate and may differ from the actual price at any given market, meaning prices are indicative and not appropriate for trading purposes. Fusion Media and any provider of the data contained in this website will not accept liability for any loss or damage as a result of your trading, or your reliance on the information contained within this website.
It is prohibited to use, store, reproduce, display, modify, transmit or distribute the data contained in this website without the explicit prior written permission of Fusion Media and/or the data provider. All intellectual property rights are reserved by the providers and/or the exchange providing the data contained in this website.
Fusion Media may be compensated by the advertisers that appear on the website, based on your interaction with the advertisements or advertisers.
© 2007-2025 - Fusion Media Limited. All Rights Reserved.