Resistance could be seen at 60.30 levels and then next resistance can be observed at 60.70 levels. Price can find support at 59.60 levels and below that strong support is seen at 59.20 levels.
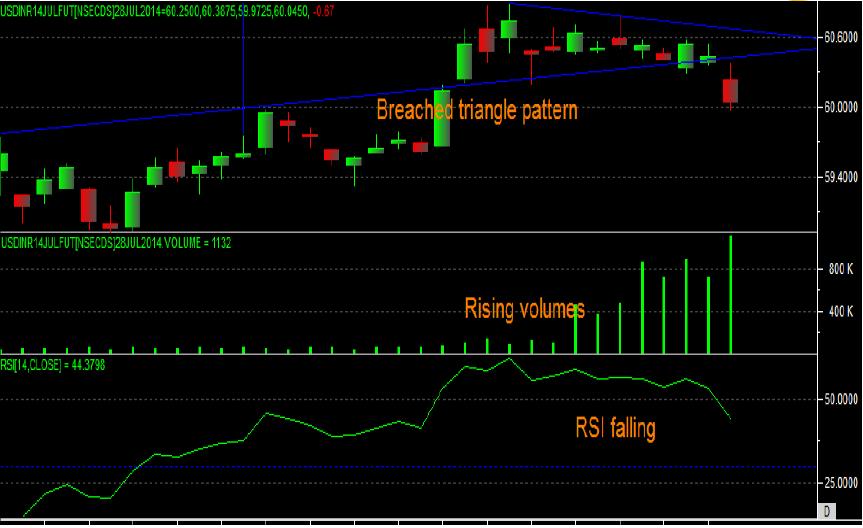
As seen below in daily price chart of MCXSX/NSE USD/INR July contract, it was trading between the range of 60.50 – 60.90 levels following with “Lower Top and Lower Bottom” Pattern from last couple of days, after making a recent high of 60.9075 levels.
Today, it gives a “Triangle pattern” coupled with the rising volumes which indicates reversal in the trend and also indicates the fresh entry of bears.
Indicator Analysis
On the oscillator front, 14 day RSI is falling and currently it’s reading at 44, which is also supportive for the bears.
Key Levels
Resistance could be seen at 60.30 levels and then next resistance can be observed at 60.70 levels. Price can find support at 59.60 levels and below that strong support is seen at 59.20 levels.
Looking at bearish price formation with rising volumes coupled with oscillators indicating pessimism, we recommend Sell in MCXSX/NSE USD/INR July contract.
Positional Call - Sell MCXSX/NSE USD/INR July between 60.05 - 60.15, SL - 60.70, Target - 59.20 (CMP - 60.05)

