The previous post had promised protection for USD/INR at 54.60 levels, and as expected the pair resisted those levels and rallied up to the 54.03 levels, which was a swift movement of nearly 1%.
Post a rate cut of 25bps and a promise for further easing on the back of better CAD and inflation numbers, the RBI governor has managed to slightly subdue the hawkish tone of its macroeconomic report.
We now have a look at the events for the coming week:
· S&P rules out an rating upgrade:
S&P ruled out a rating upgrade at the ADB conference, citing slow infra project clearances.
· Congress morale booster victory:
A likely win in Karnataka will be a morale booster for the Congress. Also, the introduction of Food & Land Acquisition bill in the parliament through an ordinance would further display Government`s resolve. However, the latest railway board scam would slightly dampen this euphoria.
· New slew of reforms:
A new slew of reforms are likely to buoy the market, with a report ons revision of FDI caps on certain sectors – Defense, Insurance, etc. - would help improve the sentiment. Also, a proposal to fast track the infrastructure clearances would further boost the investment sentiment.
· Major flow directions pointing inward
Inward flows for dominate the market for the week. Flows from Bharti – Qatar Foundation stake sell and IKEA proposal clearance and lack of demand from the Oilers may help the USD/INR to stay low.
· Global Market Events:
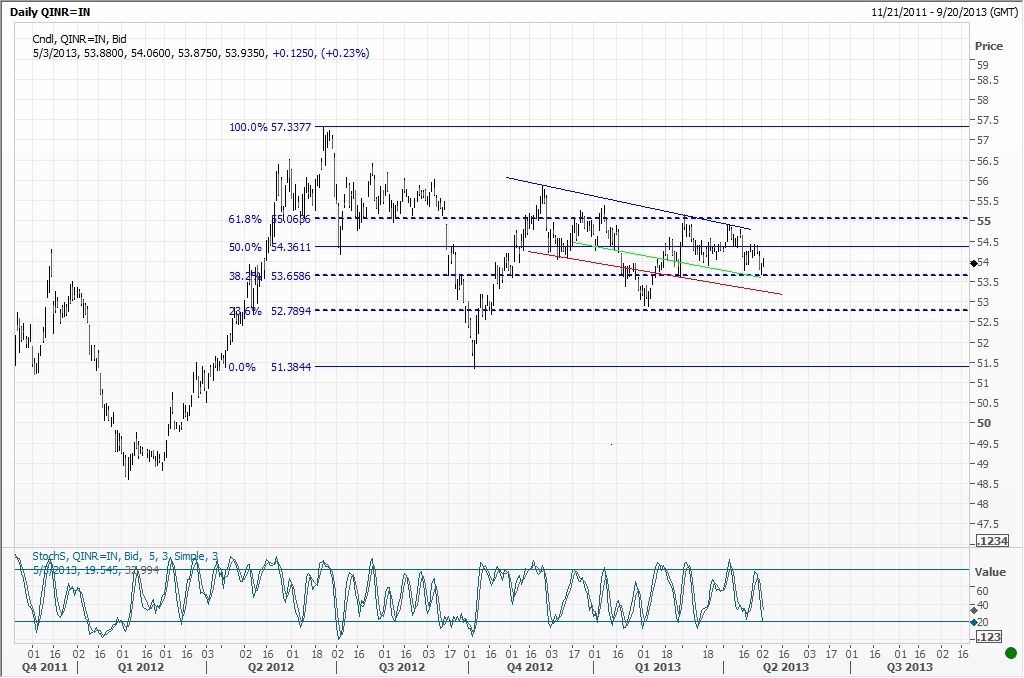
Over the medium term, the pair is likely to stay in the bearish channel of 53.60 – 54.60 levels. A likely break outside this channel would warrant a move towards the 53.30 level, with an attempt to fill the gap. This entire bearish move would be negated by a close above the 54.40 levels. USD/INR - Bearish Channel" title="USD/INR - Bearish Channel" width="1348" height="848" />
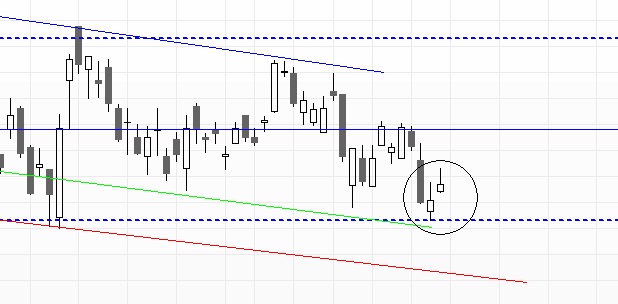
Technically, the pair faces resistance from a Fibonacci retracement and Ichimoku Tekan line at 54.03 levels, which should be a good top. 54.10 / 54.20 also appear to be decent tops to sell on rallies. Also, the pair displays a spinning top candle-stick pattern which highlights a trend reversal from the recent rally from the 53.65 to 54.03
The pair is likely to stay within the 53.65 – 54.03 range, with a possible extension to 53.50 or 54.20 levels on either end.
 USD/INR - Spinning top" title="USD/INR - Spinning top" width="1348" height="848" />
Option strategy:
A decent option strategy would be to buy a bearish Put Spread for the 54.50/53.00 level. This would mean buying a 54PUT and selling 53PUT, to play for the 54 – 53 range. A slightly aggressive and cost effective strategy would be couple this with selling of bullish call spread 54.50/55 levels. This would mean selling the costlier 54.50 Call and buying the low cost 55 Call in the anticipation for the pair to trade outside and below 54.50 levels.
Another low –cost option would be to buy a 53.75/52.75 Put spread.
Happy Investing!!!
Post a rate cut of 25bps and a promise for further easing on the back of better CAD and inflation numbers, the RBI governor has managed to slightly subdue the hawkish tone of its macroeconomic report.
We now have a look at the events for the coming week:
· S&P rules out an rating upgrade:
S&P ruled out a rating upgrade at the ADB conference, citing slow infra project clearances.
· Congress morale booster victory:
A likely win in Karnataka will be a morale booster for the Congress. Also, the introduction of Food & Land Acquisition bill in the parliament through an ordinance would further display Government`s resolve. However, the latest railway board scam would slightly dampen this euphoria.
· New slew of reforms:
A new slew of reforms are likely to buoy the market, with a report ons revision of FDI caps on certain sectors – Defense, Insurance, etc. - would help improve the sentiment. Also, a proposal to fast track the infrastructure clearances would further boost the investment sentiment.
· Major flow directions pointing inward
Inward flows for dominate the market for the week. Flows from Bharti – Qatar Foundation stake sell and IKEA proposal clearance and lack of demand from the Oilers may help the USD/INR to stay low.
· Global Market Events:
- US Markets are likely to remain bullish based on positive earnings reports and slight improvements in the Job market
- Action in the European markets likely to remain muted, on the grounds of no major data releases this week.
- BoE policy meet this week would be closely watched, for further signs of easing.
Over the medium term, the pair is likely to stay in the bearish channel of 53.60 – 54.60 levels. A likely break outside this channel would warrant a move towards the 53.30 level, with an attempt to fill the gap. This entire bearish move would be negated by a close above the 54.40 levels.
 USD/INR - Bearish Channel" title="USD/INR - Bearish Channel" width="1348" height="848" />
Technically, the pair faces resistance from a Fibonacci retracement and Ichimoku Tekan line at 54.03 levels, which should be a good top. 54.10 / 54.20 also appear to be decent tops to sell on rallies. Also, the pair displays a spinning top candle-stick pattern which highlights a trend reversal from the recent rally from the 53.65 to 54.03
The pair is likely to stay within the 53.65 – 54.03 range, with a possible extension to 53.50 or 54.20 levels on either end.
 USD/INR - Spinning top" title="USD/INR - Spinning top" width="1348" height="848" />
Option strategy:
A decent option strategy would be to buy a bearish Put Spread for the 54.50/53.00 level. This would mean buying a 54PUT and selling 53PUT, to play for the 54 – 53 range. A slightly aggressive and cost effective strategy would be couple this with selling of bullish call spread 54.50/55 levels. This would mean selling the costlier 54.50 Call and buying the low cost 55 Call in the anticipation for the pair to trade outside and below 54.50 levels.
Another low –cost option would be to buy a 53.75/52.75 Put spread.
Happy Investing!!!