USD/INR Low As Indian Election Optimism Fades?

Published 05/13/2014, 03:55 AM
Updated 07/09/2023, 06:31 AM
EUR/USD
-
USD/INR
-
  • Increase in food prices disconcerting in light India’s CPI basket, inflation expectations.
  • Reserve Bank of India to face challenges in capping inflation if we see another EM selloff.
  • Higher volatility over summer could support USD, disrupt FX carry flows.
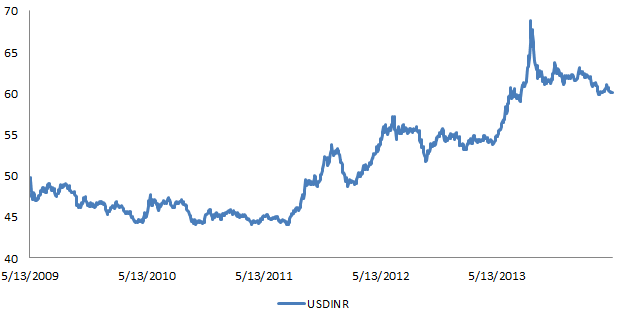
  • We have detailed over the past few weeks in our Indian Rupee pieces that the current INR run may be coming to an end. With election optimism likely to fade over the coming days / weeks and under the current inflation situation, it could be the case that we have set a low in the USD/INR cross or are very close to one. Further confidence in this bias comes with any return of USDollar strength moving into summer.

    The Rupee strengthened recently along with other EM FX pairs as low volatility in markets has pushed global investors back into the carry trade. Nevertheless, a reach for yield can reverse quickly, especially in these somewhat illiquid and complacent markets. Very low periods of high volatility are more often than not followed by periods of very high volatility and this would not bode well for emerging markets, especially in the context of possible shocks stemming from a further slowdown in Chinese growth.

    MSCI EM ETF vs. EUR/USD 6M Option Volatility
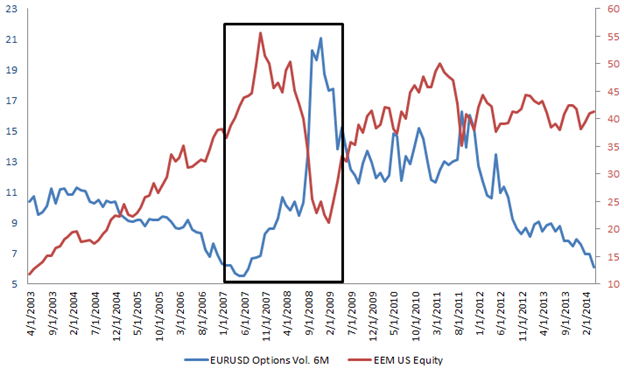
    USD/INR vs. EU/USD Chart

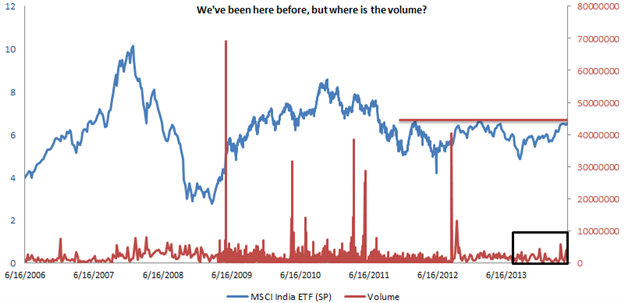
    It is important to note trends that continue to hold are approaching key periods that could contribute to USD/INR volatility and strength. For one, the MSCI EM ETF 2014 analogue with the 5yr average continues to remain a relatively good fit, although the coming month will be a true test. In addition, the MSCI India ETF has had trouble breaching current levels before and this recent move has come with incredibly low volume. (The ETF fluctuates between a 0.5 and 1.0 negative correlation with USD/INR.)

    Seasonality Analogue: MSCI Emerging Market ETF
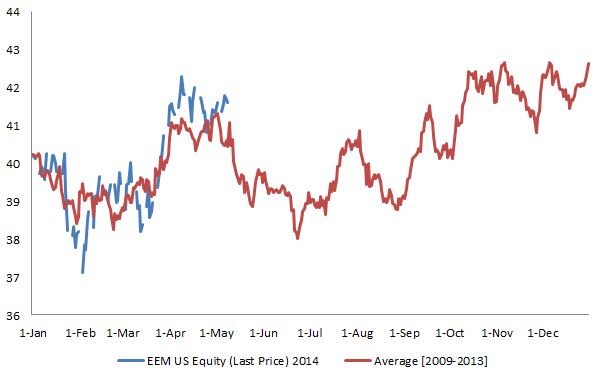
    MSCi Emerging Market ETF

    MSCI India ETF

    MSCI India ETF

    USD/INR: YTD vs. 2010
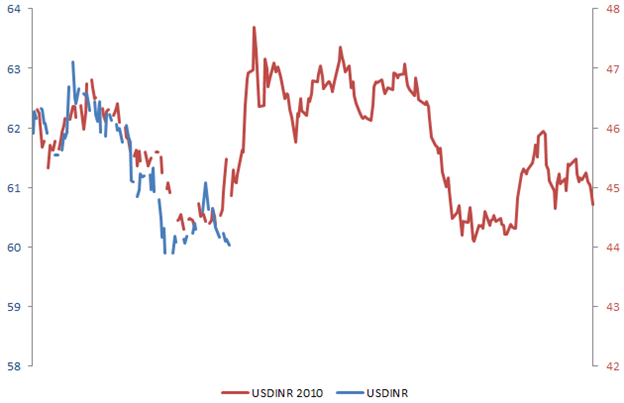
    USD/INR YTD vs. 2010

    USD/INR

    USD/INR Daily Chart

    Original post

Latest comments

Loading next article…
Risk Disclosure: Trading in financial instruments and/or cryptocurrencies involves high risks including the risk of losing some, or all, of your investment amount, and may not be suitable for all investors. Prices of cryptocurrencies are extremely volatile and may be affected by external factors such as financial, regulatory or political events. Trading on margin increases the financial risks.
Before deciding to trade in financial instrument or cryptocurrencies you should be fully informed of the risks and costs associated with trading the financial markets, carefully consider your investment objectives, level of experience, and risk appetite, and seek professional advice where needed.
Fusion Media would like to remind you that the data contained in this website is not necessarily real-time nor accurate. The data and prices on the website are not necessarily provided by any market or exchange, but may be provided by market makers, and so prices may not be accurate and may differ from the actual price at any given market, meaning prices are indicative and not appropriate for trading purposes. Fusion Media and any provider of the data contained in this website will not accept liability for any loss or damage as a result of your trading, or your reliance on the information contained within this website.
It is prohibited to use, store, reproduce, display, modify, transmit or distribute the data contained in this website without the explicit prior written permission of Fusion Media and/or the data provider. All intellectual property rights are reserved by the providers and/or the exchange providing the data contained in this website.
Fusion Media may be compensated by the advertisers that appear on the website, based on your interaction with the advertisements or advertisers.
© 2007-2025 - Fusion Media Limited. All Rights Reserved.