USDX – daily chart
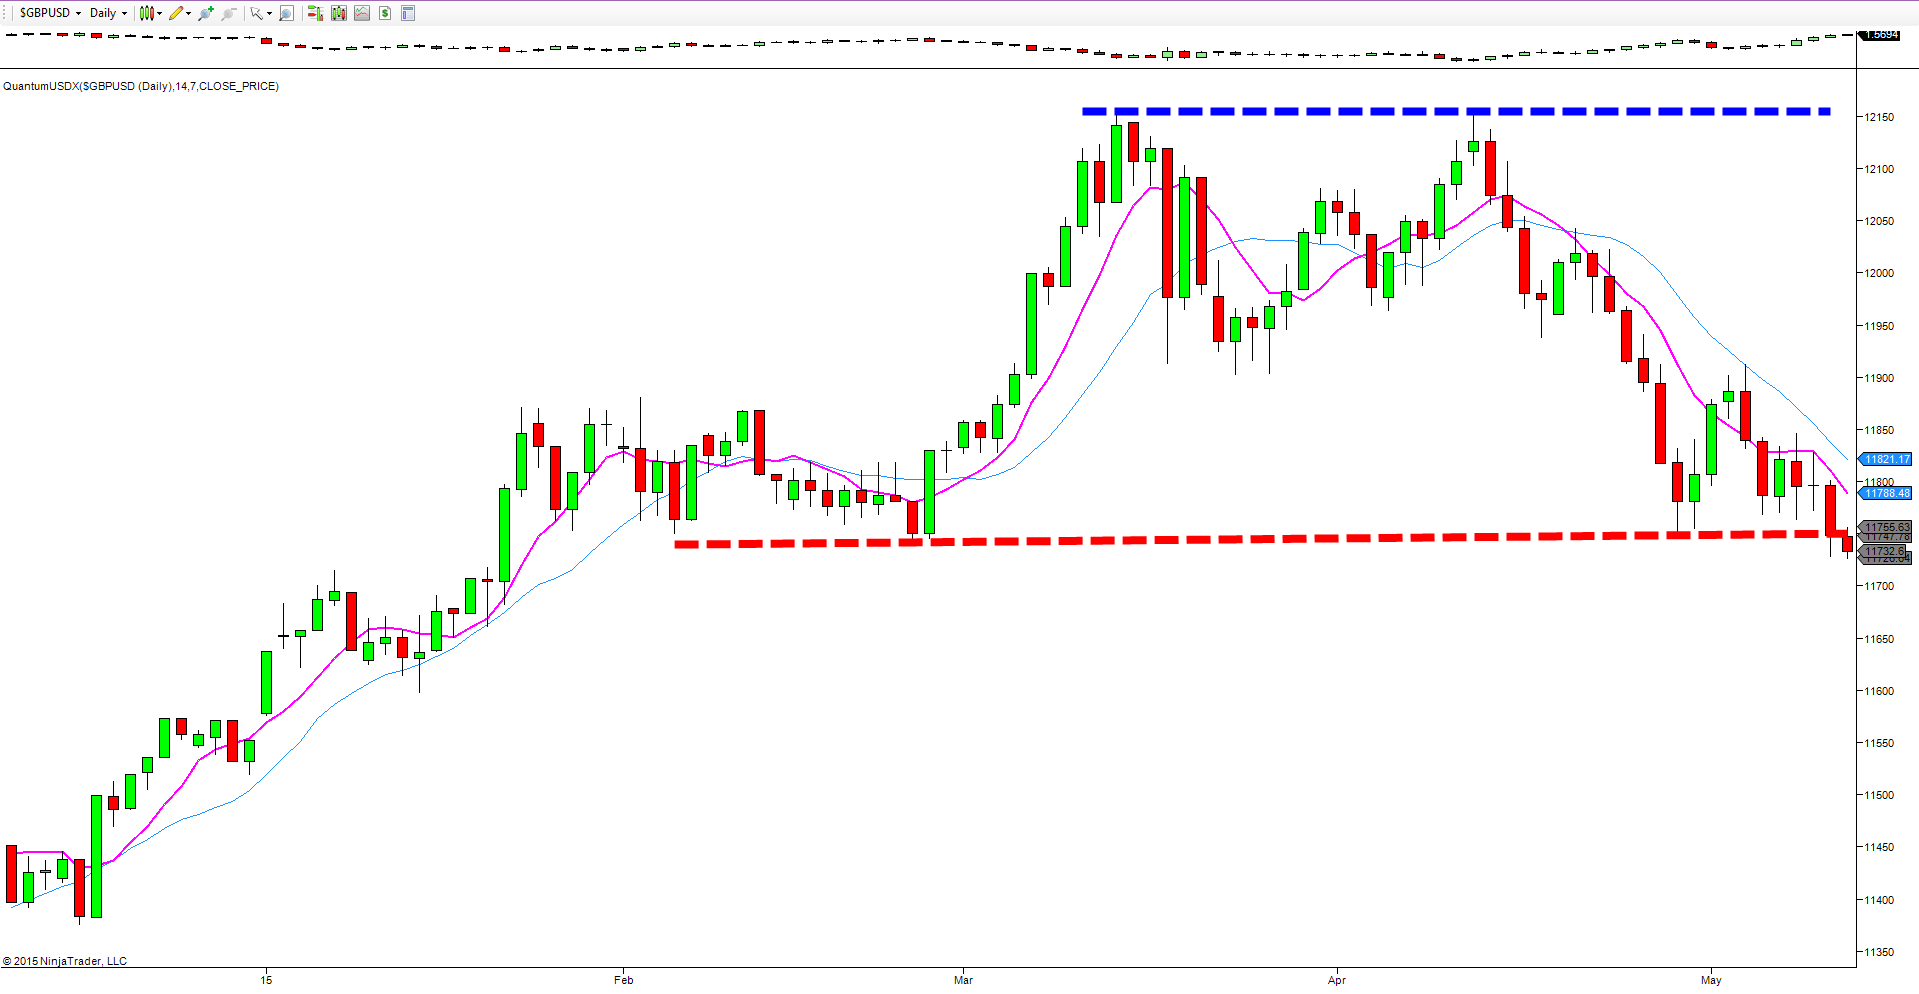
From a technical perspective, yesterday was another important one for the US dollar index on the daily chart, with the currency of first reserve weakening further against the four principle currencies of the GBP/AUD/EUR and JPY and closing with a wide spread down candle and testing the strong platform of support in the 11,750 region. This is denoted on the chart with the red dotted line, and with the double top now in place, is one of extreme significance. Indeed in overnight trading, the US dollar has continued lower and now appears to be breaking through this level to currently trade at 11,740 at the time of writing, and with the weight of price congestion now in place overhead, any close below this level is likely to translate to further downside momentum for the US dollar.

EURX – daily chart
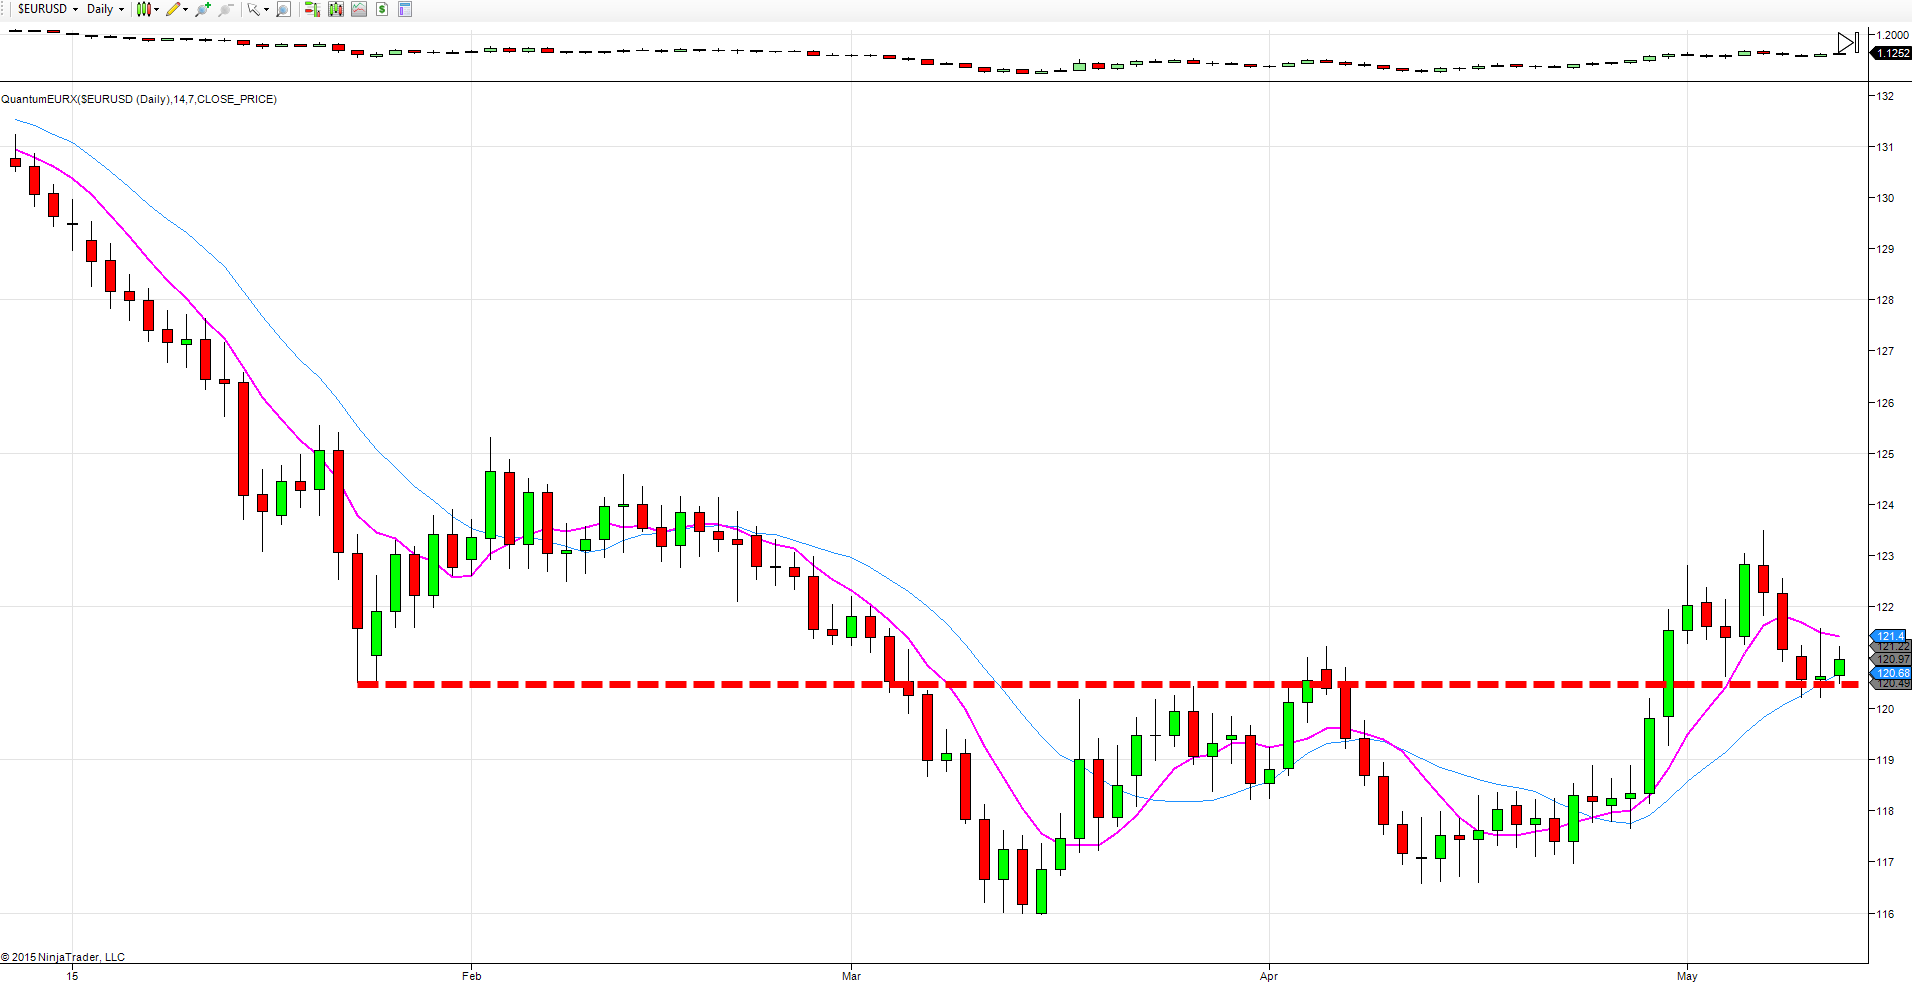
Moving to the EUR index, the recent retracement for the single currency now appears to be finding support in the 120.49 against the GBP/JPY/AUDand USD and provided this continues to hold firm, we are likely to see a bounce higher for the euro once more as it moves off the lows of the 120.49 region, and back towards the recent highs of early May in the 123.50 region.

JPYX – daily chart
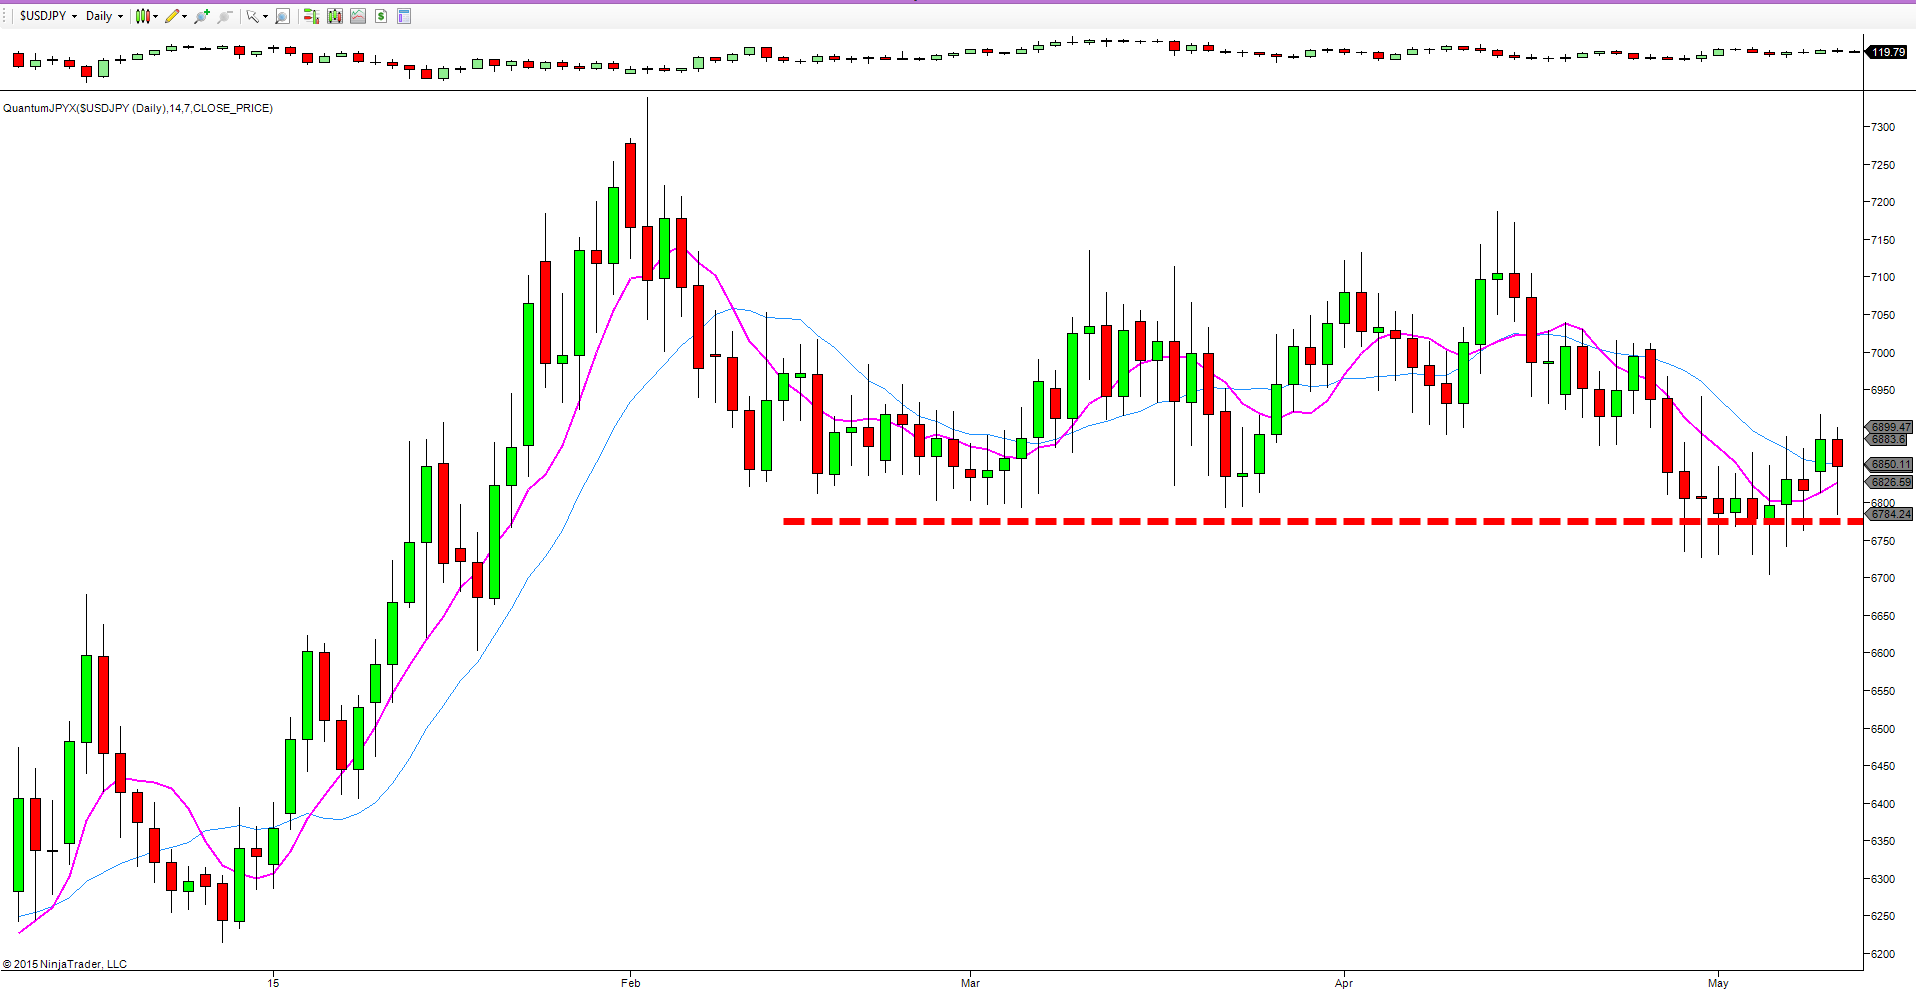
Finally to the JPY index, which continues to reflect the torpid price action for the Japanese yen, with the index trading in a relatively narrow range between 7150 to the upside and 6750 to the downside. For longer term yen traders, it is now a question of patience, whilst for intra day traders, it’s trading the money flow, as risk on and risk off appetite ebbs and flows through the counterbalance of the US dollar and the Japanese yen.
