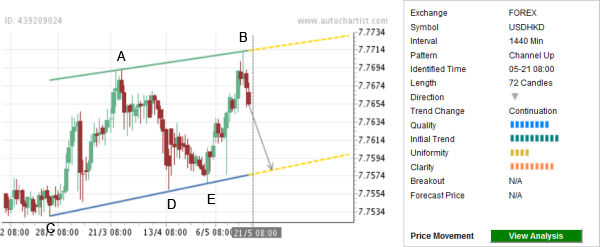
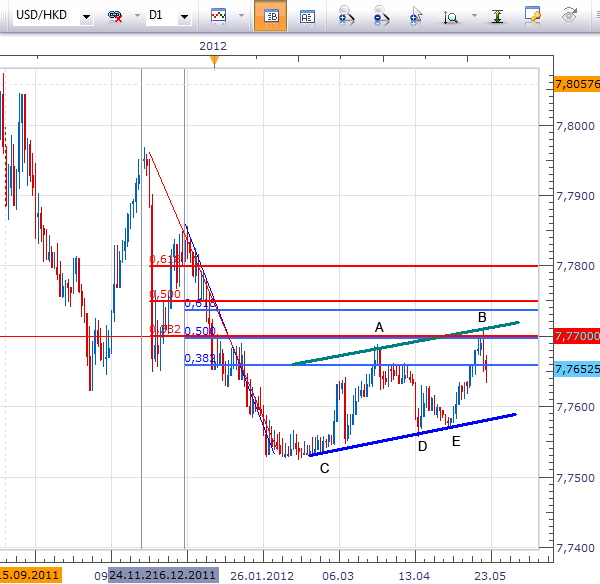
We have recently identified the high quality up channel chart pattern on the daily USD/HKD charts. The overall quality of this chart pattern is measured at the 8 bar level as a result of the sharp Initial Trend (rated at the highest 10 bar level), below-average Uniformity (4 bars) and near maximum Clarity (9 bars). The top of this Up Channel (point B on the chart below) formed when the pair reversed down from the round price level 7.7700 coinciding with the cluster of the Fibonacci Retracements made out of the 50% Fibonacci Retracement of the preceding sharp downward price thrust from the December of 2011 as well as the 38.2% Fibonacci Correction of the larger downward price impulse from the November of 2011 (as is shown on the second chart below). The pair is expected to fall further toward the lower support trendline of this Up Channel in the nearest time.

The following daily USD/HKD chart highlights the technical price levels mentioned above:


The following daily USD/HKD chart highlights the technical price levels mentioned above:

