Investing.com’s stocks of the week
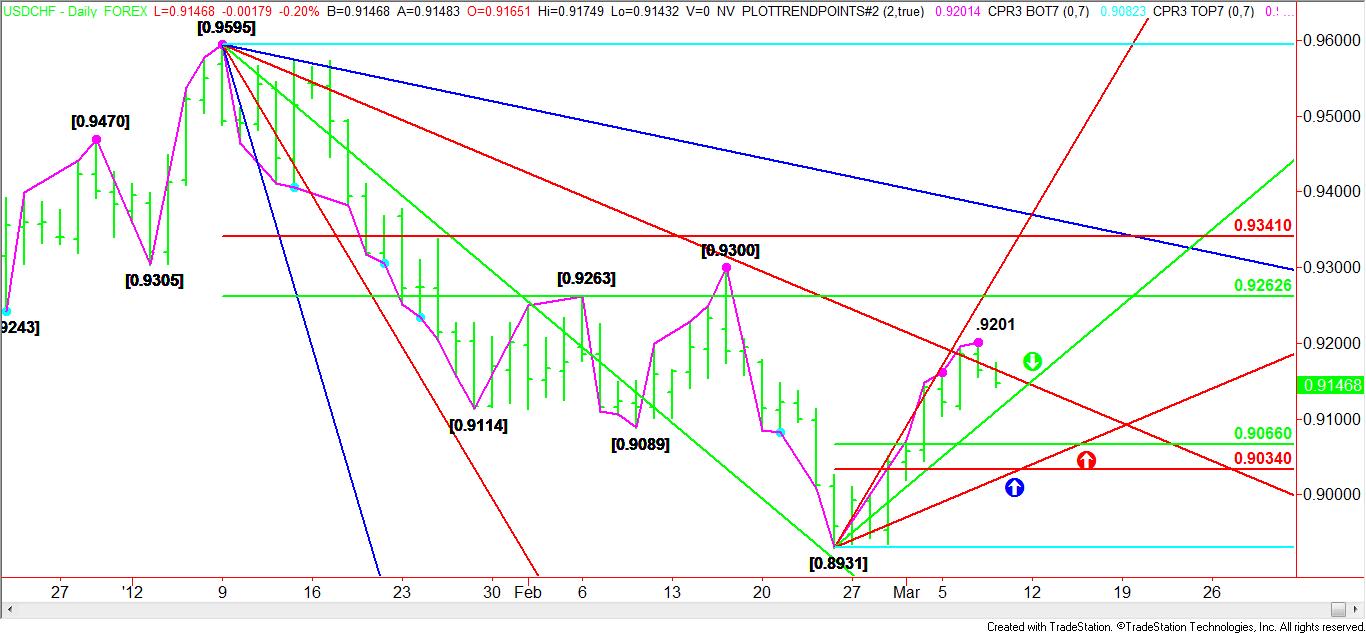
After briefly piercing a downtrending Gann angle at .9175 on Wednesday, the USD CHF closed back below it while posting a daily closing price reversal top. The subsequent follow-through to the downside, confirmed the top at .9201, setting up the currency pair for a potential 2 to 3 day break into a key 50 to 61.8 percent retracement zone.
Today, downtrending Gann angle resistance drops in at .9165. Based on the short-term range of .8931 to .9201, traders should look for the start of a break into .9066 to .9034 over the near-term. Before reaching this downside objective, the USD CHF must take out the uptrending Gann angle at .9111. Once the market clears this angle, it could go into a freefall until it reaches the retracement zone objective.
There are several key points that traders should pay close attention to as this move develops. The first one is identified by the blue arrow which points at a possible support cluster at .9031 to .9034 on March 9. The second is identified by the green arrow which isolates a possible resistance cluster at .9145 to .9151 on March 12. The red arrow recognizes an uptrending Gann angle and Fibonacci retracement level cluster at .9066 to .9061 and .9071 to .9066 on March 14 and March 15.
With the potential top already set in motion, strong downside momentum on increasing volume will be needed to break the uptrending Gann angle at .9131. If this occurs, then traders should look for an acceleration to the downside.
