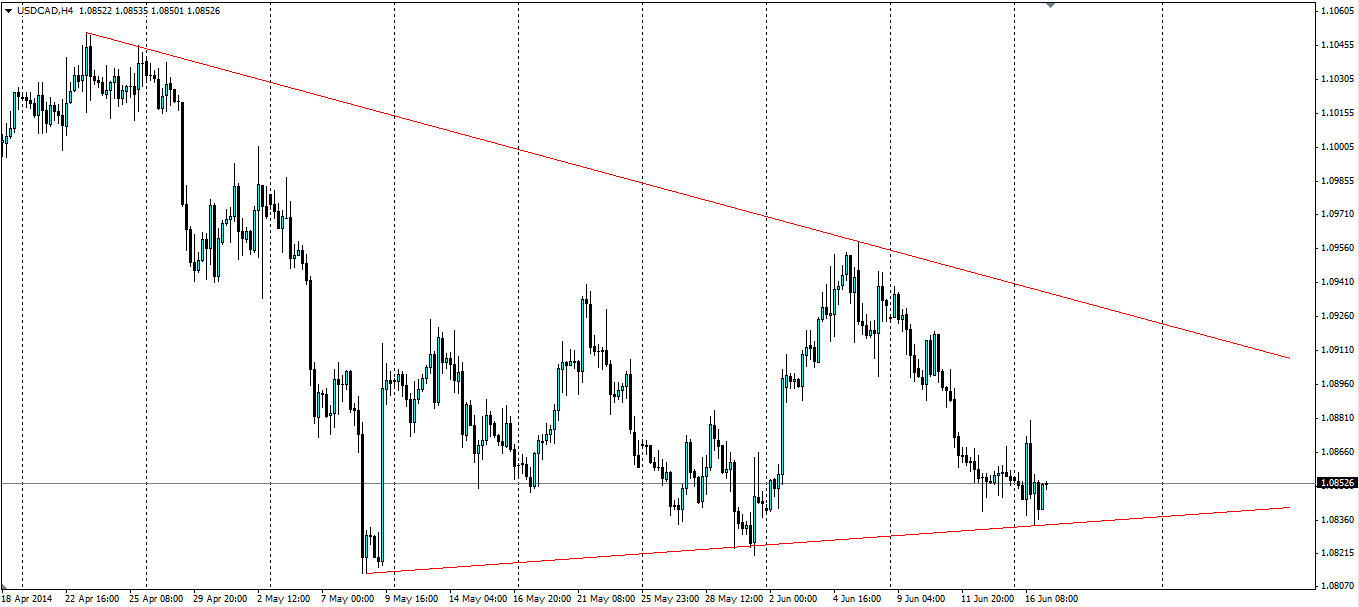
The US Dollar and the Canadian Dollar pair are currently forming a pennant as the price looks to consolidate inwards. The current level is at the bottom of the shape and a movement back towards the top bearish line is likely, so why not take advantage.

The US dollar has lost quite a bit of ground lately as the tension in Iraq and the threat of a civil war in a very productive oil region, weighs on the world’s largest economy. A reduction in oil from Iraq would push the oil prices upwards, which may benefit Canada as energy products make up23.6% of total exports. The cost of oil production in Canada is also an issue (think oil sands) with many projects unprofitable under $100 a barrel, so a high oil price may actually spur economic activity in Canada, much to the delight of Bank of Canada Governor Poloz, who has been disappointed with the growth rates of Canada’s economy. The US economy on the other hand suffers at the hands of a high oil price as economic activity is stifled.
For now the increased price of crude oil is factored into the USD/CAD cross rate, however further swings will have an impact. At the current level the price is sitting close to the bottom bullish line of the pennant shape. A breakout to the downside is unlikely as this line has been tested three times and held firm on each occasion, but a another shock to the price of oil could send the USD/CAD crashing through, so traders should be vigilant and keep a stop loss tight under this line.
News events this week that could affect this pair are both US and Canadian CPI figures. Both are expected to be steady but the market is prone to being shocked, especially when it comes to inflation figures as these have such a bearing on monetary policy, so these should be watched closely. US Unemployment could also provide a bit of volatility for the USD.
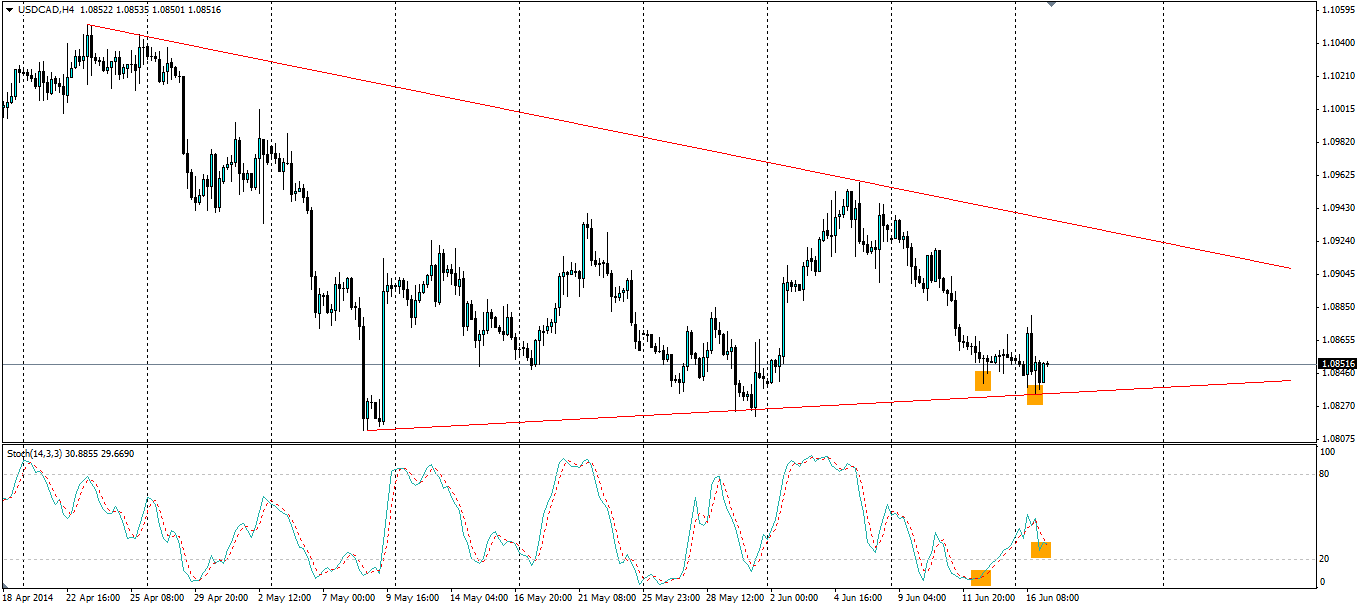
The Stochastic Oscillator is pointing to a bullish movement up to the top line of the shape. We can see the price has painted a lower low as it tested the bottom of the pennant, however the oscillator has made a higher low, indicating a bullish divergence and giving us a buy signal. It may be unwise to wait for the price to test the support line again before entering, so entry at market price would be fine.

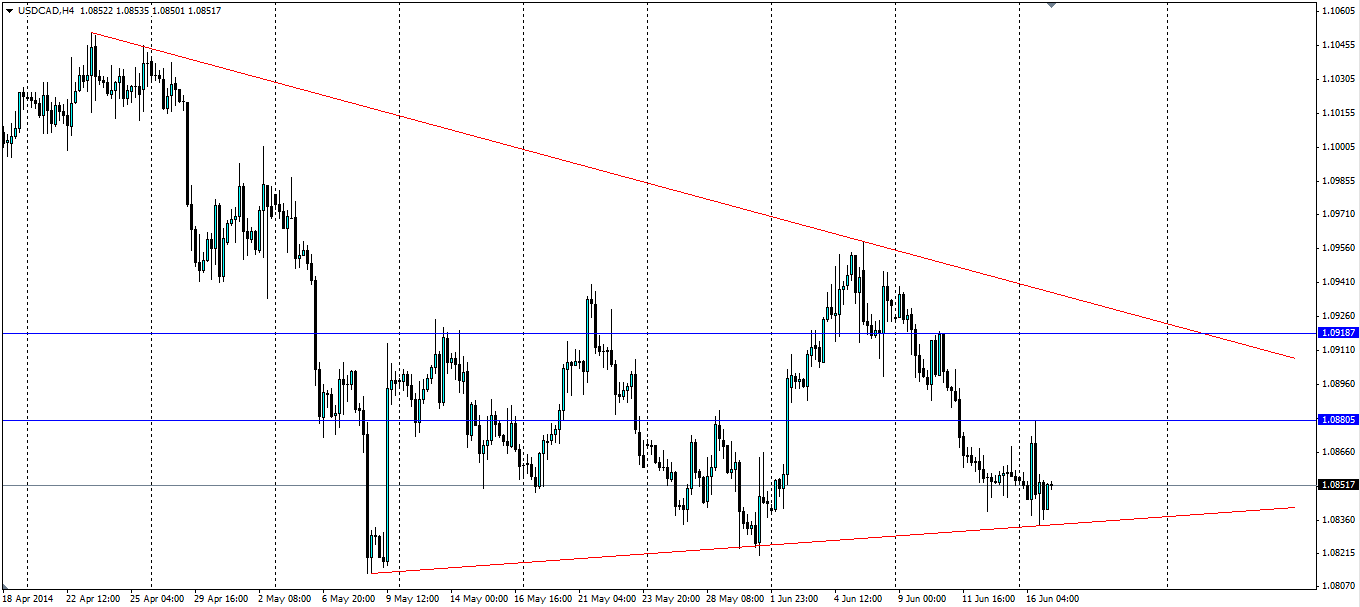
Several targets exist in the shape of previous resistance/support levels. 1.0881 was the resistance met at the previous high, and 1.0919 was support turned resistance on the way down from the touch of the bearish trend line. The third and most obvious target is the bearish trend line that makes the top line of the pennant shape. This will act as dynamic resistance so traders targeting this will need to actively manage their exit.

The USD/CAD pair is forming a pennant shape and looking likely to head up towards the bearish resistance line. Events in Iraq and CPI figures could hamper or assist a bullish movement and should be watched, but at this stage, the Stoch indicator points to its likelihood.
