The lack of political news last week, combined with new economic statistics that essentially met market expectations, went a long way to maintaining the USD/CAD in a narrow range of 90 points last week. On another front, Greece received the $130 billion Euros it had been promised, allowing it to avoid defaulting on a 14.5 billion euro payment on its debt that is due on March 20. The IMF has said that these funds will allow Greece to stay afloat until 2014-2015, but this is based on earlier growth projections for Greece. In reality, the austerity measures in Greece are so severe that many market stakeholders believe that a third rescue plan will need to be implemented by 2013.
Canada
Little economic data is expected in Canada this week. The Leading Indicators Index for February will be released on Wednesday. This will be followed by the Retail Sales indicator for January on Thursday, which is expected at 1.8%, an increase of 2% from the last reading. The week in Canadian news ends with the Consumer Price Index for February, which analysts expect to be 2.1%.
United States
No data worth mentioning will be released in the U.S. this week, apart from the Conference Board Leading Index for February expected on Thursday. Much like the corresponding Canadian index, this composite index of 10 key indicators predicts economic changes. With the Federal Reserve’s indications at its last two meetings that it wants to maintain rates at record low levels until 2014, it will be interesting to have New Home Sales figures for February, expected Friday, to see if the real estate market has begun to turn around.
International
The week in international news begins on Wednesday with the release of Trade Balance numbers for Japan. Germany’s Purchasing Managers’ Index will then be revealed on Thursday, as well as the Consumer Confidence Index for the Eurozone. They are expected to be 49.6 and -19.8, respectively. On Friday, Spain will be issuing treasury bills with 12-month and 18-month maturities. With the second round of the long term financing operation (LTRO) now complete and over 1,000 billion Euros of liquidity circulating in the various banks of the Eurozone, we are expecting greater appetite for Spain’s bonds, with lower rates as a result. Have a good week!
The Loonie
« If a man who cannot count finds a four-leaf clover, is he lucky? »
Despite all the economic news received last week, the USD/CAD pair was very stable over the last five trading sessions. It would appear that it found a comfort zone over the last few weeks and will stay there until a clear direction emerges. In contrast to the USD/CAD pair, it was an eventful week for many classes of financial assets. Investors reacted very favourably to the announcement by the Federal Open Market Committee (FOMC) last Tuesday concerning the key interest rate and the state of the U.S. economy. With this in mind, we decided to take a closer look at two types of financial instruments that benefited from the attentions of investors and the media: U.S. equities (S&P 500) and gold. Typically, growing interest in the shares of large U.S. corporations indicates more risk taking by investors. However, holding precious metals is a defensive position taken to preserve capital, so it reflects less appetite for risk.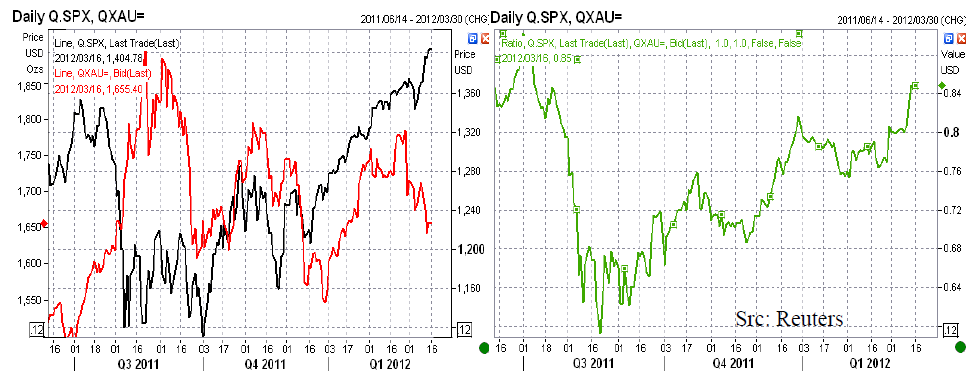
As can be seen in the above graph (on the left), prices in these two asset classes diverged. While investors returned to corporate equities (the black line), which reached their highest level in three years, the price of an ounce of gold (the red line) struggled to hold on to the gains of the last few months. The graph on the right provides additional information; rather than comparing the cost of an ounce of gold in U.S. dollars to the cost of the Standard & Poor’s index of the largest 500 U.S. corporations, also in U.S. dollars, the green line shows the number of ounces of gold required to buy one unit of the S&P 500 Index. It shows how today’s market demands much more gold to purchase a unit of the index than at any time since July 2011. In other words, good economic news is driving the S&P 500. It remains to be seen whether the Canadian dollar will follow suit.
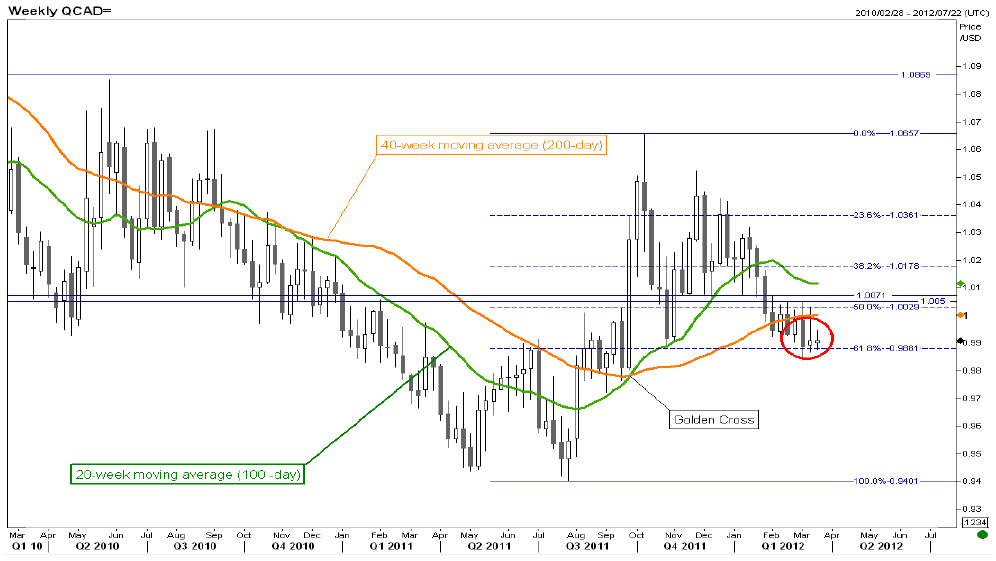
Technical Analysis: (Friday, March 16, 2012, USD/CAD graph of weekly data)
USD/CAD: Even if the rebounds of the last few weeks stopped in the famous 1.0050-1.0072 range, the sellers appear to have run out of steam, as can be seen in last week’s candle (Harami, red circle). As long as a breakdown is avoided at 1.0050, the USD/CAD, which is still below its long-term moving averages, could continue to fall. Closing below 0.9880 (61.8% of the movement from 0.9400 to 1.0657) would make this more likely.
EUR/CAD: The trend remains bearish, but the current rebound that began with a morning star pattern at 1.2880 could continue up to 1.3110 or 1.3180 (graph available on request).
S&P 500: Slight adjustment in the Elliott wave count that we described two weeks ago: The v of Wave 3 should be equal to the i Wave and therefore end at 1.465. The correction that should follow could reach 1,290 (graph available on request).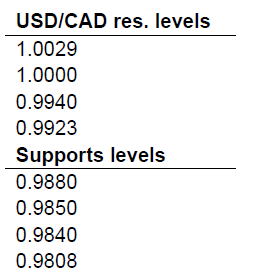
Fixed Income
Bond yields rose and the Canadian yield curve steepened sharply last week, as signs of economic growth and comments from the Fed encouraged investors to invest in riskier asset classes.
This increase, the sharpest since August, was mainly caused by the acknowledgement from the US Fed that the job market is improving in its last official announcement on Wednesday.
Even the short end of the curve hedged higher after the comments, suggesting traders are questioning the sustainability of the recent commitment to pursue a ZIRP (Zero Interest Rate Policy) until the end of 2014.
On the other hand, some observers suggested the Fed could enter into a third quantitative easing program to fight the recent rise in long term rates and push companies to borrow and invest more to propel the economy.
At home, on Friday, Stat Can data suggested another reason of the pressure on Canadian rates could be the recent slowdown in non-resident acquisitions of Canadian bonds. A drop in foreigners demand for Canadian paper could exacerbate this recent rise in long term borrowing costs.
As for the weather that we’ve experienced in Montreal lately suggests spring has finally arrived, we’ll see if this move upwards is truly a turning point or just another false start. We’ll watch US housing data on Tuesday and Thursday, as well as Canadian retail sales and inflation data, respectively Thursday and Friday. Enjoy your week.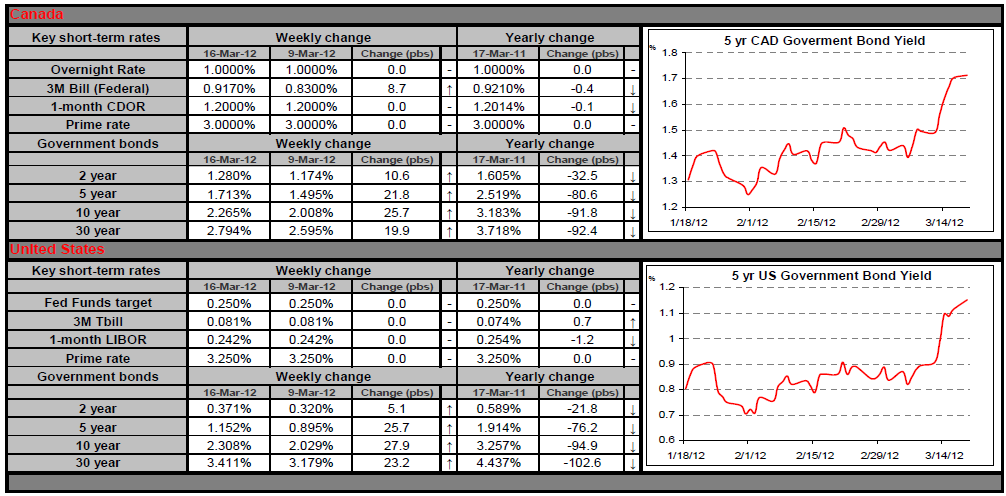
Commodities
President Barack Obama and David Cameron, Prime Minister of the U.K., are currently considering tapping into their countries’ strategic reserves to counter soaring oil prices. It should be noted that the last time strategic reserves were used was in June 2011 during the Libyan conflict. The announcement had caused the price of Light Sweet Crude (WTI) to drop over 4% at the time. The effect was temporary, though—one month later WTI was up 10%. Such measures could nevertheless help the President, who needs to pull out all the stops if he wants to be re-elected. These rumours brought down energy prices at the start of the week, but on Friday, improved market conditions and excellent U.S. economic figures drove them up again. It remains to be seen if this bullish trend will be sustained over the next few days. Have a great week!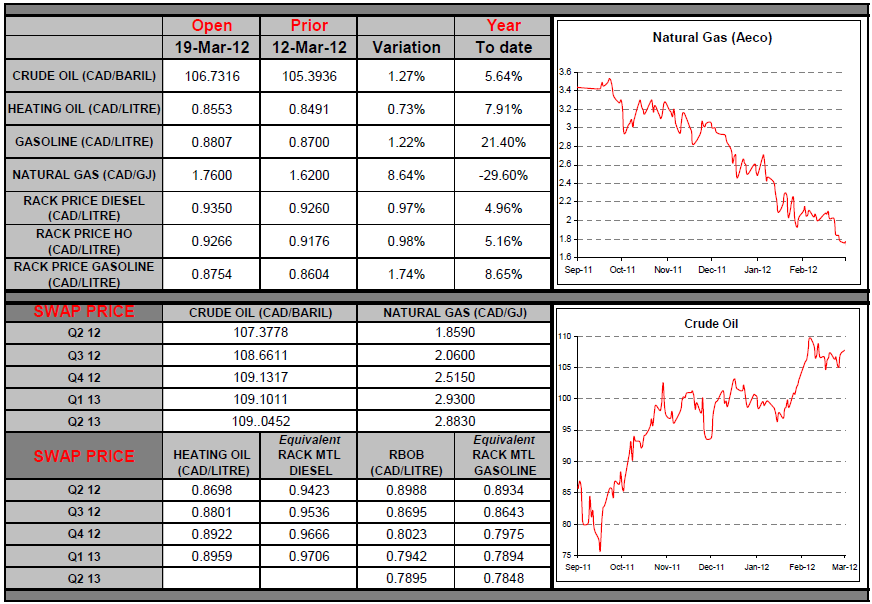
Last Week at a Glance
Canada – Overall capacity utilization moved up five ticks to 80.5% in the final quarter of 2011. The ramp up in manufacturing output in recent quarters lifted the utilization rate in this sector to 80.4% from 76.9% a year earlier. This was due primarily to a U.S.-driven jump in auto production. In fact, capacity utilization in the transportation equipment manufacturing category rose to 88.5%, its highest mark since 2007Q1. The output gap is closing, slowly but surely. Canada's new-vehicle sales soared 15.4% in January to 153,623 units. This was the next highest monthly unit sales ever, second only to the record set in January 2008. All provinces registered higher sales. However, Statistics Canada’s preliminary estimate for February had auto sales retreating 7%. Assuming the February estimate pans out and the level then holds steady in March, new-vehicle sales are tracking at +31.3% annualized in the first quarter of the year. In January, Canadian factory shipments fell 0.9%, confounding consensus expectations for a 0.2% gain. Lower sales were reported in 11 of 21 industries, led by primary metals, mineral products, aerospace and machinery. In volume terms, shipments shrank 1.1% after swelling 1.3% the previous month. However, with the United States on the upswing and domestic demand holding firm, we can expect shipments to rebound sooner rather than later. January's contraction in volumes will impact January GDP, though inventory growth should dampen the blow somewhat. Separately, Canadian securities transaction data showed foreigners reduced their Canadian holdings by $4.2 billion in January. They were net buyers of bonds (+C$1.9 billion), positive on government securities while slightly negative on corporate assets for a second consecutive month, but proved net sellers of money market instruments (-C$4.6 billion) and stocks (-C$1.4 billion). The last time foreigners sold more than they bought was in June 2011.
United States – In February, retail sales rose 1.1%, their largest monthly increase since September 2011. Gains were broad based and followed a 0.6% advance in January (revised up from an initial estimate of 0.4%). Car sales sprang 1.6%, reversing the previous month’s decline. Excluding autos, gas and building materials, core retail sales grew 0.5%. January core sales growth was revised up to +1.0%. The mild weather experienced this winter made for lower heating needs, thus leaving more money in the pockets of consumers to spend on other goods. The CPI report for February was roughly in line with consensus. The all-items index rose 0.4%, its largest month-over-month increase since April 2011. Energy prices climbed 3.2% on strong impulse from gasoline (+6%) while food prices were flat. The sharp upturn in gasoline accounted for about 80% of the change in total CPI for the month. Still, the annual inflation rate held steady at 2.9%, with last year’s February increase of 0.4% repeated this year. Excluding food and energy, prices were only 0.1% higher on the month, half what consensus expected. There were cost increases in medical care and education, but these were counterbalanced by decreases in apparel and tobacco prices. Motor vehicle prices rose for the first time in six months thanks to a strong ramp up in demand. The year-on-year core CPI slipped a tick to 2.2% from the month before.
The U.S. Producer Price Index rose 0.4% in February. This caused the year-on-year rate to drop eight ticks to 3.3%, in line with consensus expectations. Excluding food and energy, prices climbed 0.2%, keeping the yearon- year core PPI level at 3%, a notch above the 2.9% expected by consensus. Still, in the past three months, core PPI has grown 3.6% on an annualized basis, suggesting the presence of some upward pressure in the inflation pipeline. The first reading on March economic activity was released by the New York Fed. The Empire State Manufacturing Index easily topped consensus expectations by rising to 20.21 on the month, its highest point since June 2010. However, the details of the index were less upbeat, as the shipments index sank more than four points to a four-month low of 18.2. The new-orders component, for its part, sagged for the second straight month, settling at 6.84. Both of these sub-indices, however, remained in expansion territory. Separately, the March Philadelphia Fed Index of manufacturing activity beat expectations as well by jumping more than two points to 12.5, its highest reading since April of last year. The new-orders sub-index slid to 3.3 after surging to 11.7 the prior month. The shipments sub-index plunged to 3.5 after soaring to 15 the month before. In February, industrial production held level after mounting 0.4% in January. Manufacturing production expanded modestly (+0.3%) while mining activity shrank 1.2%. Owing to relatively mild weather, utility production was flat; it had declined 2.2% and 3.0%, respectively, the two previous months.
- English (UK)
- English (India)
- English (Canada)
- English (Australia)
- English (South Africa)
- English (Philippines)
- English (Nigeria)
- Deutsch
- Español (España)
- Español (México)
- Français
- Italiano
- Nederlands
- Português (Portugal)
- Polski
- Português (Brasil)
- Русский
- Türkçe
- العربية
- Ελληνικά
- Svenska
- Suomi
- עברית
- 日本語
- 한국어
- 简体中文
- 繁體中文
- Bahasa Indonesia
- Bahasa Melayu
- ไทย
- Tiếng Việt
- हिंदी
USD/CAD Remains in Narrow Range
Published 03/20/2012, 03:11 AM
Updated 05/14/2017, 06:45 AM
USD/CAD Remains in Narrow Range
Latest comments
Loading next article…
Install Our App
Risk Disclosure: Trading in financial instruments and/or cryptocurrencies involves high risks including the risk of losing some, or all, of your investment amount, and may not be suitable for all investors. Prices of cryptocurrencies are extremely volatile and may be affected by external factors such as financial, regulatory or political events. Trading on margin increases the financial risks.
Before deciding to trade in financial instrument or cryptocurrencies you should be fully informed of the risks and costs associated with trading the financial markets, carefully consider your investment objectives, level of experience, and risk appetite, and seek professional advice where needed.
Fusion Media would like to remind you that the data contained in this website is not necessarily real-time nor accurate. The data and prices on the website are not necessarily provided by any market or exchange, but may be provided by market makers, and so prices may not be accurate and may differ from the actual price at any given market, meaning prices are indicative and not appropriate for trading purposes. Fusion Media and any provider of the data contained in this website will not accept liability for any loss or damage as a result of your trading, or your reliance on the information contained within this website.
It is prohibited to use, store, reproduce, display, modify, transmit or distribute the data contained in this website without the explicit prior written permission of Fusion Media and/or the data provider. All intellectual property rights are reserved by the providers and/or the exchange providing the data contained in this website.
Fusion Media may be compensated by the advertisers that appear on the website, based on your interaction with the advertisements or advertisers.
© 2007-2025 - Fusion Media Limited. All Rights Reserved.
