The USD/CAD reached the first objective signaled by its daily closing price reversal bottom formed on September 14 at .9633. Typically, this chart pattern signals a minimum two-to-three day rally equal to at least 50% of the last range. Based on the August 23 top at .9948 to the September 14 bottom at .9633, the first objective of this reversal bottom was .9790, followed by .9828. Overnight the Forex pair reached a high of .9811 which fell inside the retracement zone. Since the main trend is down on the daily chart, traders were likely waiting inside this zone to refresh their short positions.
In addition to the retracement zone, a downtrending Gann angle at .9821 proved to be an important resistance factor. Early in the trading session, the USD CAD crossed to the bullish side of a steep uptrending Gann angle at .9793 but quickly fell back under it after meeting resistance. If the selling pressure continues, traders can expect a break back into the 50% retracement level created by the .9633 to .9811 range at .9722. In addition, uptrending Gann angle support comes in at .9713, creating a possible downside target and support cluster at .9722 to .9713.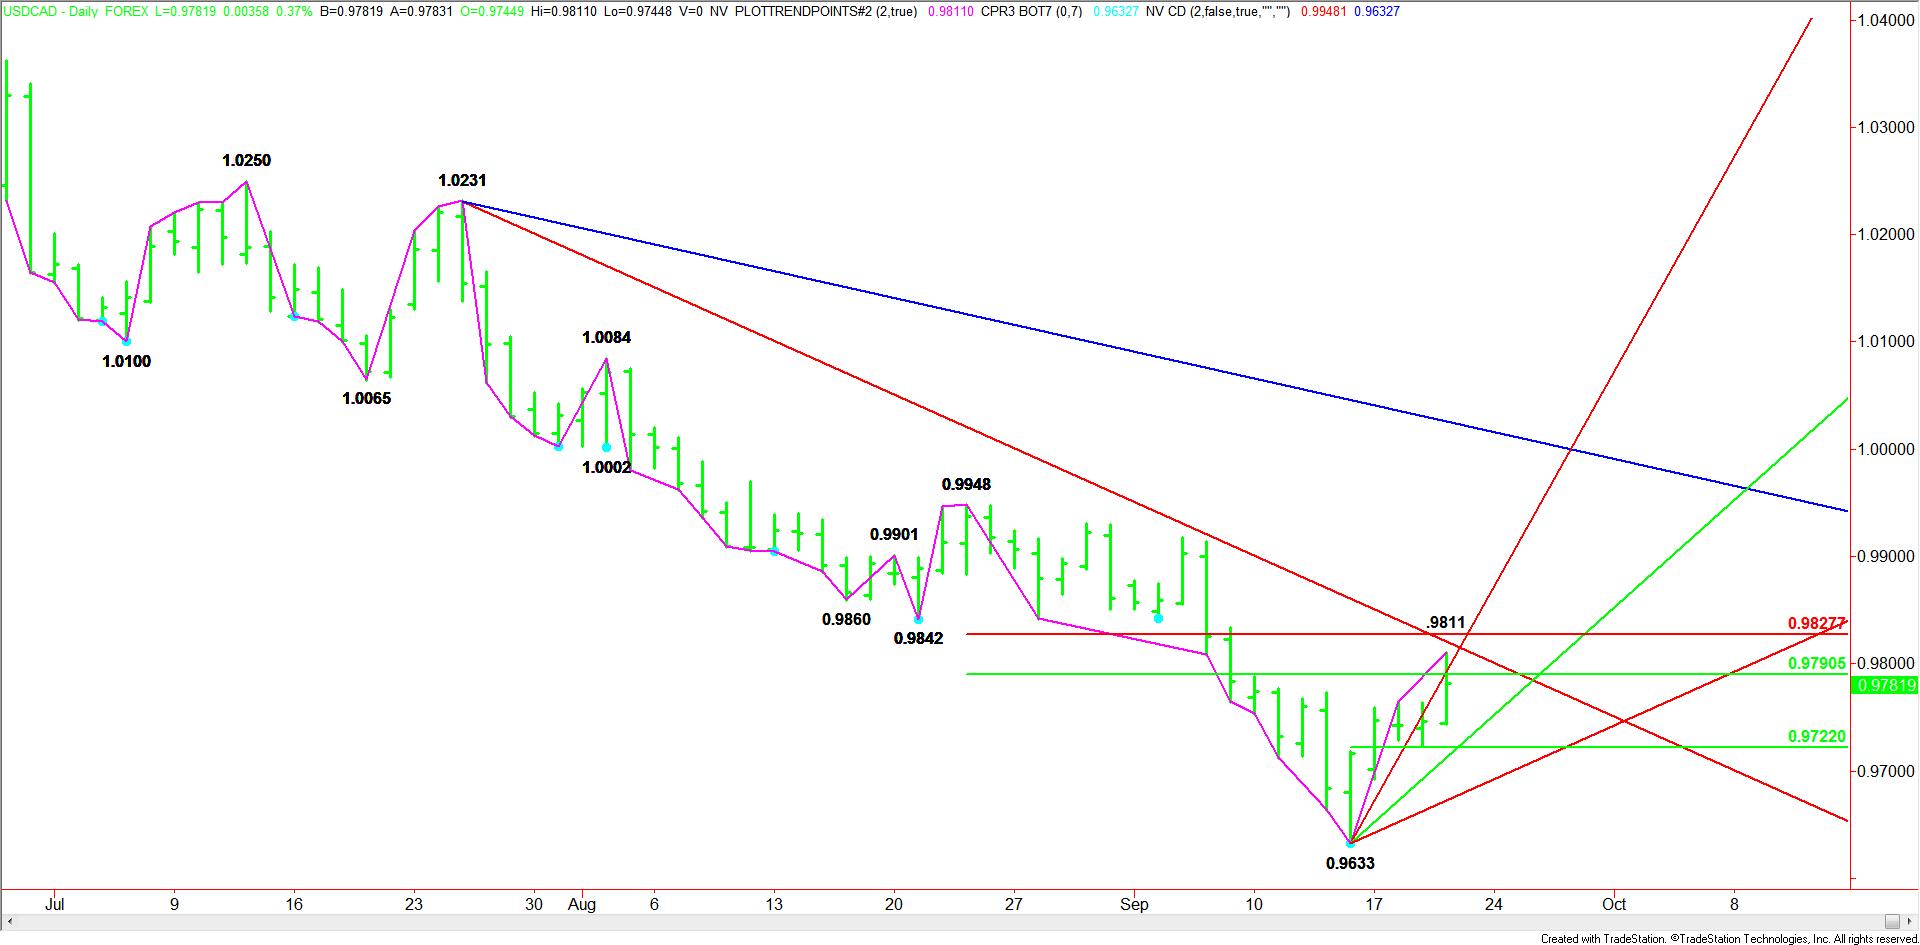 USD/CAD Pattern, Price & Time Analysis" title="Daily USDCAD Pattern, Price & Time Analysis" width="641" height="471">
Fundamentally, after rallying to a 13-month high, the Canadian Dollar appears to be running out of steam against the U.S. Dollar. Some traders feel that the last leg of the break was triggered by expectations of additional stimulus from the Federal Reserve rather than from solid economic news. A large part of the rally also came from speculation that the European Central Bank would also provide additional stimulus.
May Be Overbought
While international capital flows may have also contributed to the Canadian Dollar rally, bearish traders cite the country’s record trade deficit, falling manufacturing sales and a weak housing market as warnings that the currency may be overbought.
With the first part of the bottoming process out of the way, a test of the recent bottom at .9633 is likely. If the USD/CAD can survive this test then it could form a secondary higher bottom. This would be a strong sign that the market is getting ready to rally even further.
- English (UK)
- English (India)
- English (Canada)
- English (Australia)
- English (South Africa)
- English (Philippines)
- English (Nigeria)
- Deutsch
- Español (España)
- Español (México)
- Français
- Italiano
- Nederlands
- Português (Portugal)
- Polski
- Português (Brasil)
- Русский
- Türkçe
- العربية
- Ελληνικά
- Svenska
- Suomi
- עברית
- 日本語
- 한국어
- 简体中文
- 繁體中文
- Bahasa Indonesia
- Bahasa Melayu
- ไทย
- Tiếng Việt
- हिंदी
USD/CAD Indicates Sentiment Shift
Published 09/20/2012, 08:02 AM
USD/CAD Indicates Sentiment Shift
Latest comments
Loading next article…
Install Our App
Risk Disclosure: Trading in financial instruments and/or cryptocurrencies involves high risks including the risk of losing some, or all, of your investment amount, and may not be suitable for all investors. Prices of cryptocurrencies are extremely volatile and may be affected by external factors such as financial, regulatory or political events. Trading on margin increases the financial risks.
Before deciding to trade in financial instrument or cryptocurrencies you should be fully informed of the risks and costs associated with trading the financial markets, carefully consider your investment objectives, level of experience, and risk appetite, and seek professional advice where needed.
Fusion Media would like to remind you that the data contained in this website is not necessarily real-time nor accurate. The data and prices on the website are not necessarily provided by any market or exchange, but may be provided by market makers, and so prices may not be accurate and may differ from the actual price at any given market, meaning prices are indicative and not appropriate for trading purposes. Fusion Media and any provider of the data contained in this website will not accept liability for any loss or damage as a result of your trading, or your reliance on the information contained within this website.
It is prohibited to use, store, reproduce, display, modify, transmit or distribute the data contained in this website without the explicit prior written permission of Fusion Media and/or the data provider. All intellectual property rights are reserved by the providers and/or the exchange providing the data contained in this website.
Fusion Media may be compensated by the advertisers that appear on the website, based on your interaction with the advertisements or advertisers.
© 2007-2025 - Fusion Media Limited. All Rights Reserved.