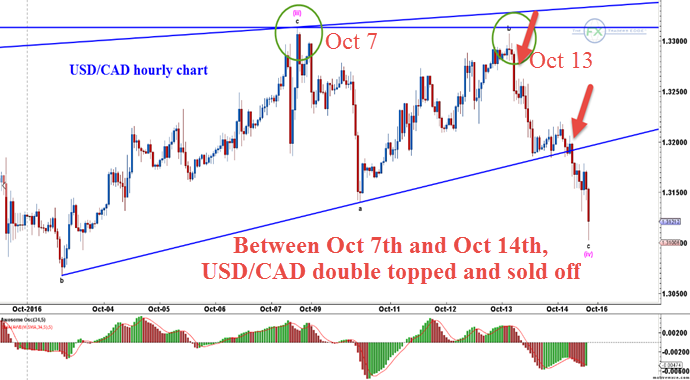
The USD/CAD is trading at 1.3140 after a volatile daywhich saw USD/CAD trading as high as 1.3220 and as low as 1.3103.From a Daily Pivot point perspective, the USD/CAD opened on Thursday at 5pm at 1.3192, traded up towards the daily pivot, traded down to almost S2 on Friday after several news releases, to end the day back at S1. In the hourly chart above, last week’s analysis talked about a potential peak on October 7thbut it took all week long for price to come down and then retest the October 7thhigh in a classic double top, which is also an Elliott Wave flat pattern. This occurred yesterday, on October 13thand was followed by a test and break of the upward sloping trend line to play out wave c of this flat formation, in a nice 200 pip move for c.
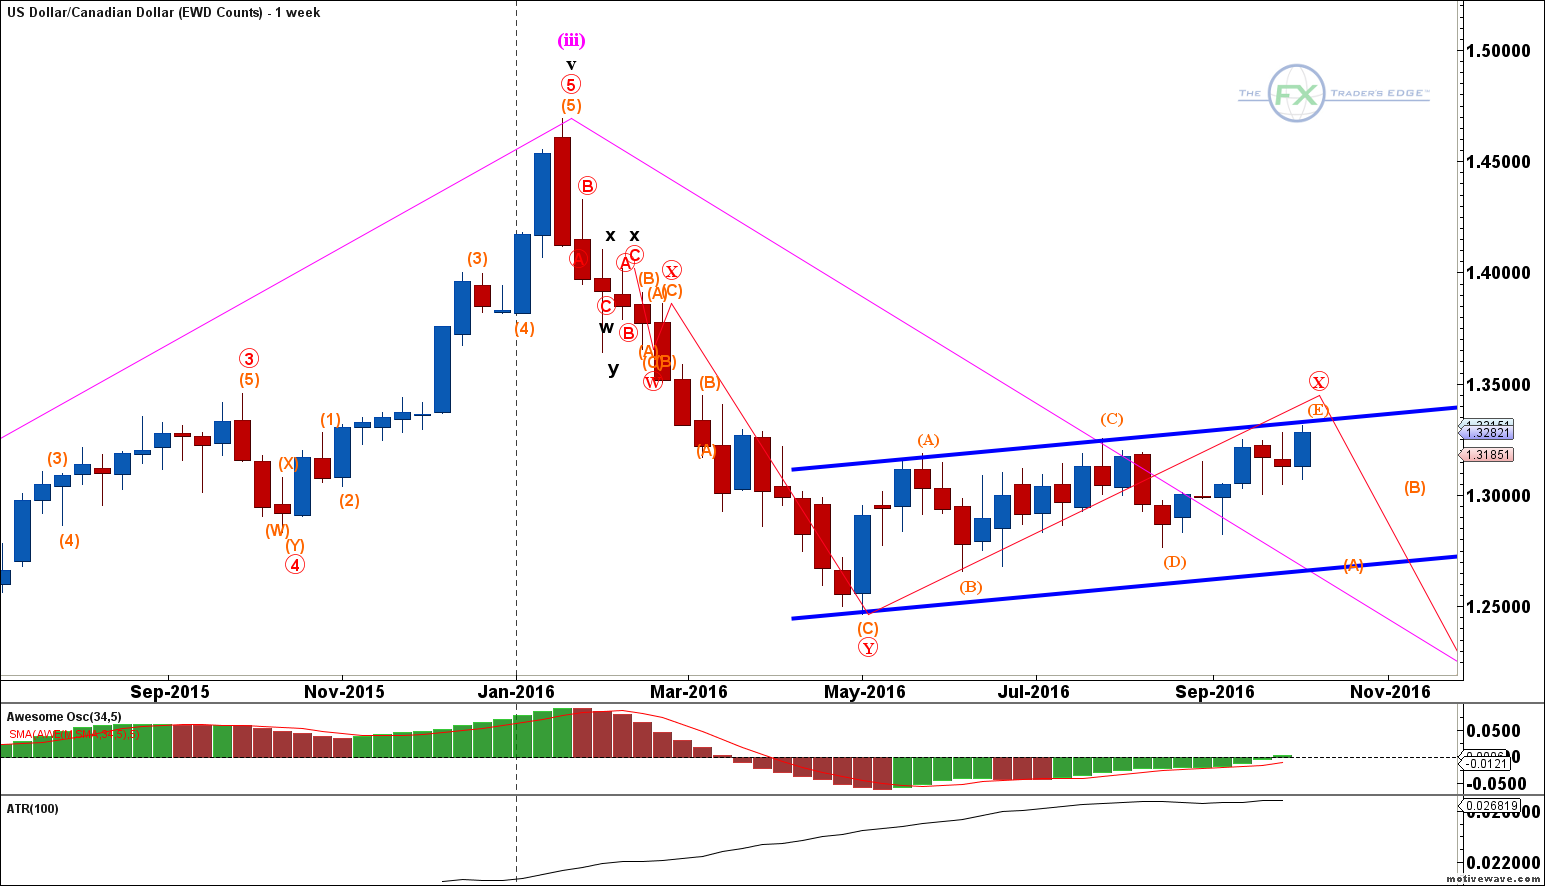
Last week when analyzing the Elliott Wave Desk wave count on the USD/CAD we wrote: Looking at the Weekly time frame, the USD/CAD is drawing out a nice upward sloping pattern which we are labeling as an ABCDE triangle. We are currently in the orange E leg which will complete red Wave X once done. What that means is, the current swing move is still up and the initial target is the channel line and the 38.2% Fibonacci retracement of the prior swing move at 1.3313. We have met our target and although price could travel further, we are satisfied with this move and will begin to look for a confirmed reversal from these or slightly higher levels.See Weekly chart below.

Our Elliott Wave Desk view for the coming week is that USD/CAD finds support in this area of the wave iv correction. Next week, look to see if USD/CAD trades up in 3 waves or in 5 waves. A 3-wave move is a correction of this abc wave iv and will likely mean lower levels for USD/ CAD. If the market moves up in 5-waves, which means trend move in Elliott Wave terms, then it is quite possible that the magenta wave v will take the USD/CAD higher once again, but still within this upward sloping channel.
