Forex News and Events
Where will the real stop?
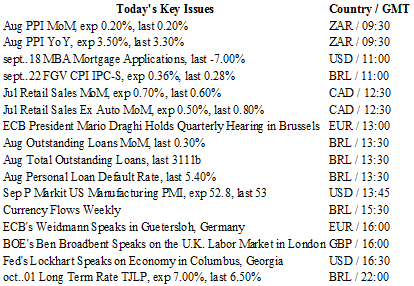
As expected, the Brazilian real plunged to a new record low against the dollar, reaching 4.0665 to the dollar yesterday in São Paulo. The upside is widely open as the last resistance of 4.0665 from October 2002 was broken; USD/BRL printed a new all-time high at 4.0665. The big question now is how low can the real actually go?
Unfortunately, all indications point toward even further weakness for the Brazilian real. Inflation levels continue to move higher as the mid-month IPCA gauge printed at 9.57% yesterday, above an anticipated 9.56%. Most importantly, the BCB is having a hard time to anchor inflation expectations against the backdrop of a highly uncertain political environment and persistent low commodity prices. According to the latest BCB’s survey, inflation expectations for 2015 rose to 9.34% from 9.28% a week ago, while expectations for 2016 climbed to 5.70% from 5.64%, moving further away from the 2016 central bank’s target of 4.5%.
The only way of offering some respite to the BRL, and eventually to seeing a stronger BRL, is to restore investor confidence in the government’s ability to shore up support for austerity measures. For months, Dilma Rousseff’s government has been facing tough opposition in congress against austerity measures, which would see a cut in spending and an increase in taxes. For now, Brazil’s future is still clouded with uncertainty and we do not see any reason for the situation to improve in the near future as long as this political gridlock remains.
China’s data disappoint
Weak data out of China has sent FX traders back into safely seeking mode. USD and JPY continue to stay in demand with traders selling high-beta currencies across the board. In the G10 space, AUD remains the primary recipient of bearish sentiment while in EM currencies, the BRL continues to spiral lower. In China, the PBoC raised the USD/CNY fix for the third day in a row to 6.3773. Despite the weaker yuan, Chinese President Xi Jinping told a group of business leader in Seattle that China would not devalue their currency with the aim to increase exports. In addition, President Jinping stated that there was no basis for further yuan deprecation as the economy was functioning "within the proper range." Clearly the market was unconvinced as China’s equity markets (and most of Asia) closed lower. In regards to the issue of cyber crime, President Jinping stated "the Chinese government will not engage in commercial theft or encourage or support such attempts by anyone." On the data front, surprisingly China’s Caixin flash manufacturing PMI dropped to 47.0 in September (six-year low) against an expected increase to 47.5 from 47.3 in August. It was new export orders that fell the most to 45.8 (-0.8pp). New orders which stands as a proxy for global demand fell to 46 from 46.6 in August. With investors hoping for a bit of good news from China the disappointment was difficult to digest. However, given that flash PMI generally sample from small-to-mid sized business, there is a possibility that the Governments massive stimulus kicked off this summer has not trickled down. With headwinds escalating on the Chinese economy we anticipate more fiscal and monetary easing in Q4.
GBP/USD - Challenging key support


The Risk Today
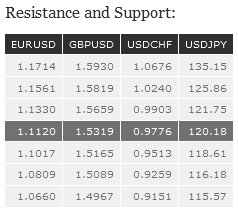
EUR/USD has breached the support at 1.1248, confirming an underlying downtrend since the near term peak at 1.1438. Strong support can be found at 1.1017 (18/08/2015 low). Strong resistance lies at 1.1714 (24/08/2015 high). In the longer term, the symmetrical triangle from 2010-2014 favored further weakness towards parity. As a result, we view the recent sideways moves as a pause in an underlying declining trend. Key supports can be found at 1.0504 (21/03/2003 low) and 1.0000 (psychological support). We have broken the resistance at 1.1534 (03/02/2015 reaction high). We are entering an upside momentum.
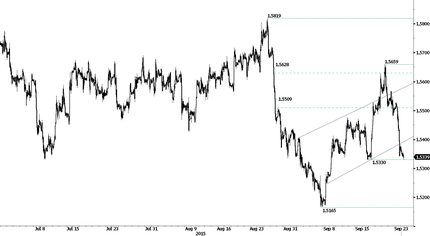
GBP/USD has broken the support at 1.5385 (uptrend channel), opening the way for a new test of the support implied by key hourly support given at 1.5330 (15/09/2015 low). Hourly resistance can be found at 1.5659 (27/08/2015 high). Stronger support is given at 1.5165 (04/09/2015 low). In the longer term, the technical structure looks like a recovery bottom whose maximum upside potential is given by the strong resistance at 1.6189 (Fibo 61% entrancement).
USD/JPY is moving in either direction around the 200-day moving average. Hourly support is given at 118.61 (04/09/2015 low). Stronger support can be found at 116.18 (24/08/2015 low). Hourly resistance can be found at 121.75 (28/08/2015 high). A long-term bullish bias is favored as long as the strong support at 115.57 (16/12/2014 low) holds. A gradual rise towards the major resistance at 135.15 (01/02/2002 high) is favored. A key support can be found at 118.18 (16/02/2015 low).
USD/CHF is still bouncing back after breaking hourly broken support at 0.9668 (14/09/2015 low). Hourly resistance lies at 0.9824 (09/09/2015 high). On the very short-term term, the technical structure is setting lower highs. However we remain bullish in the medium-term. In the long-term, the pair has broken resistance at 0.9448 suggesting the end of the downtrend. This reinstates the bullish trend. Key support can be found 0.8986 (30/01/2015 low).

